The author believes that one of the effective ways of interpreting the visualizations is understanding their origin, the logical reasoning - why it was created, what kind of information it represents, how did representations develop into the current approaches - in short, an evolution of the visualizations.
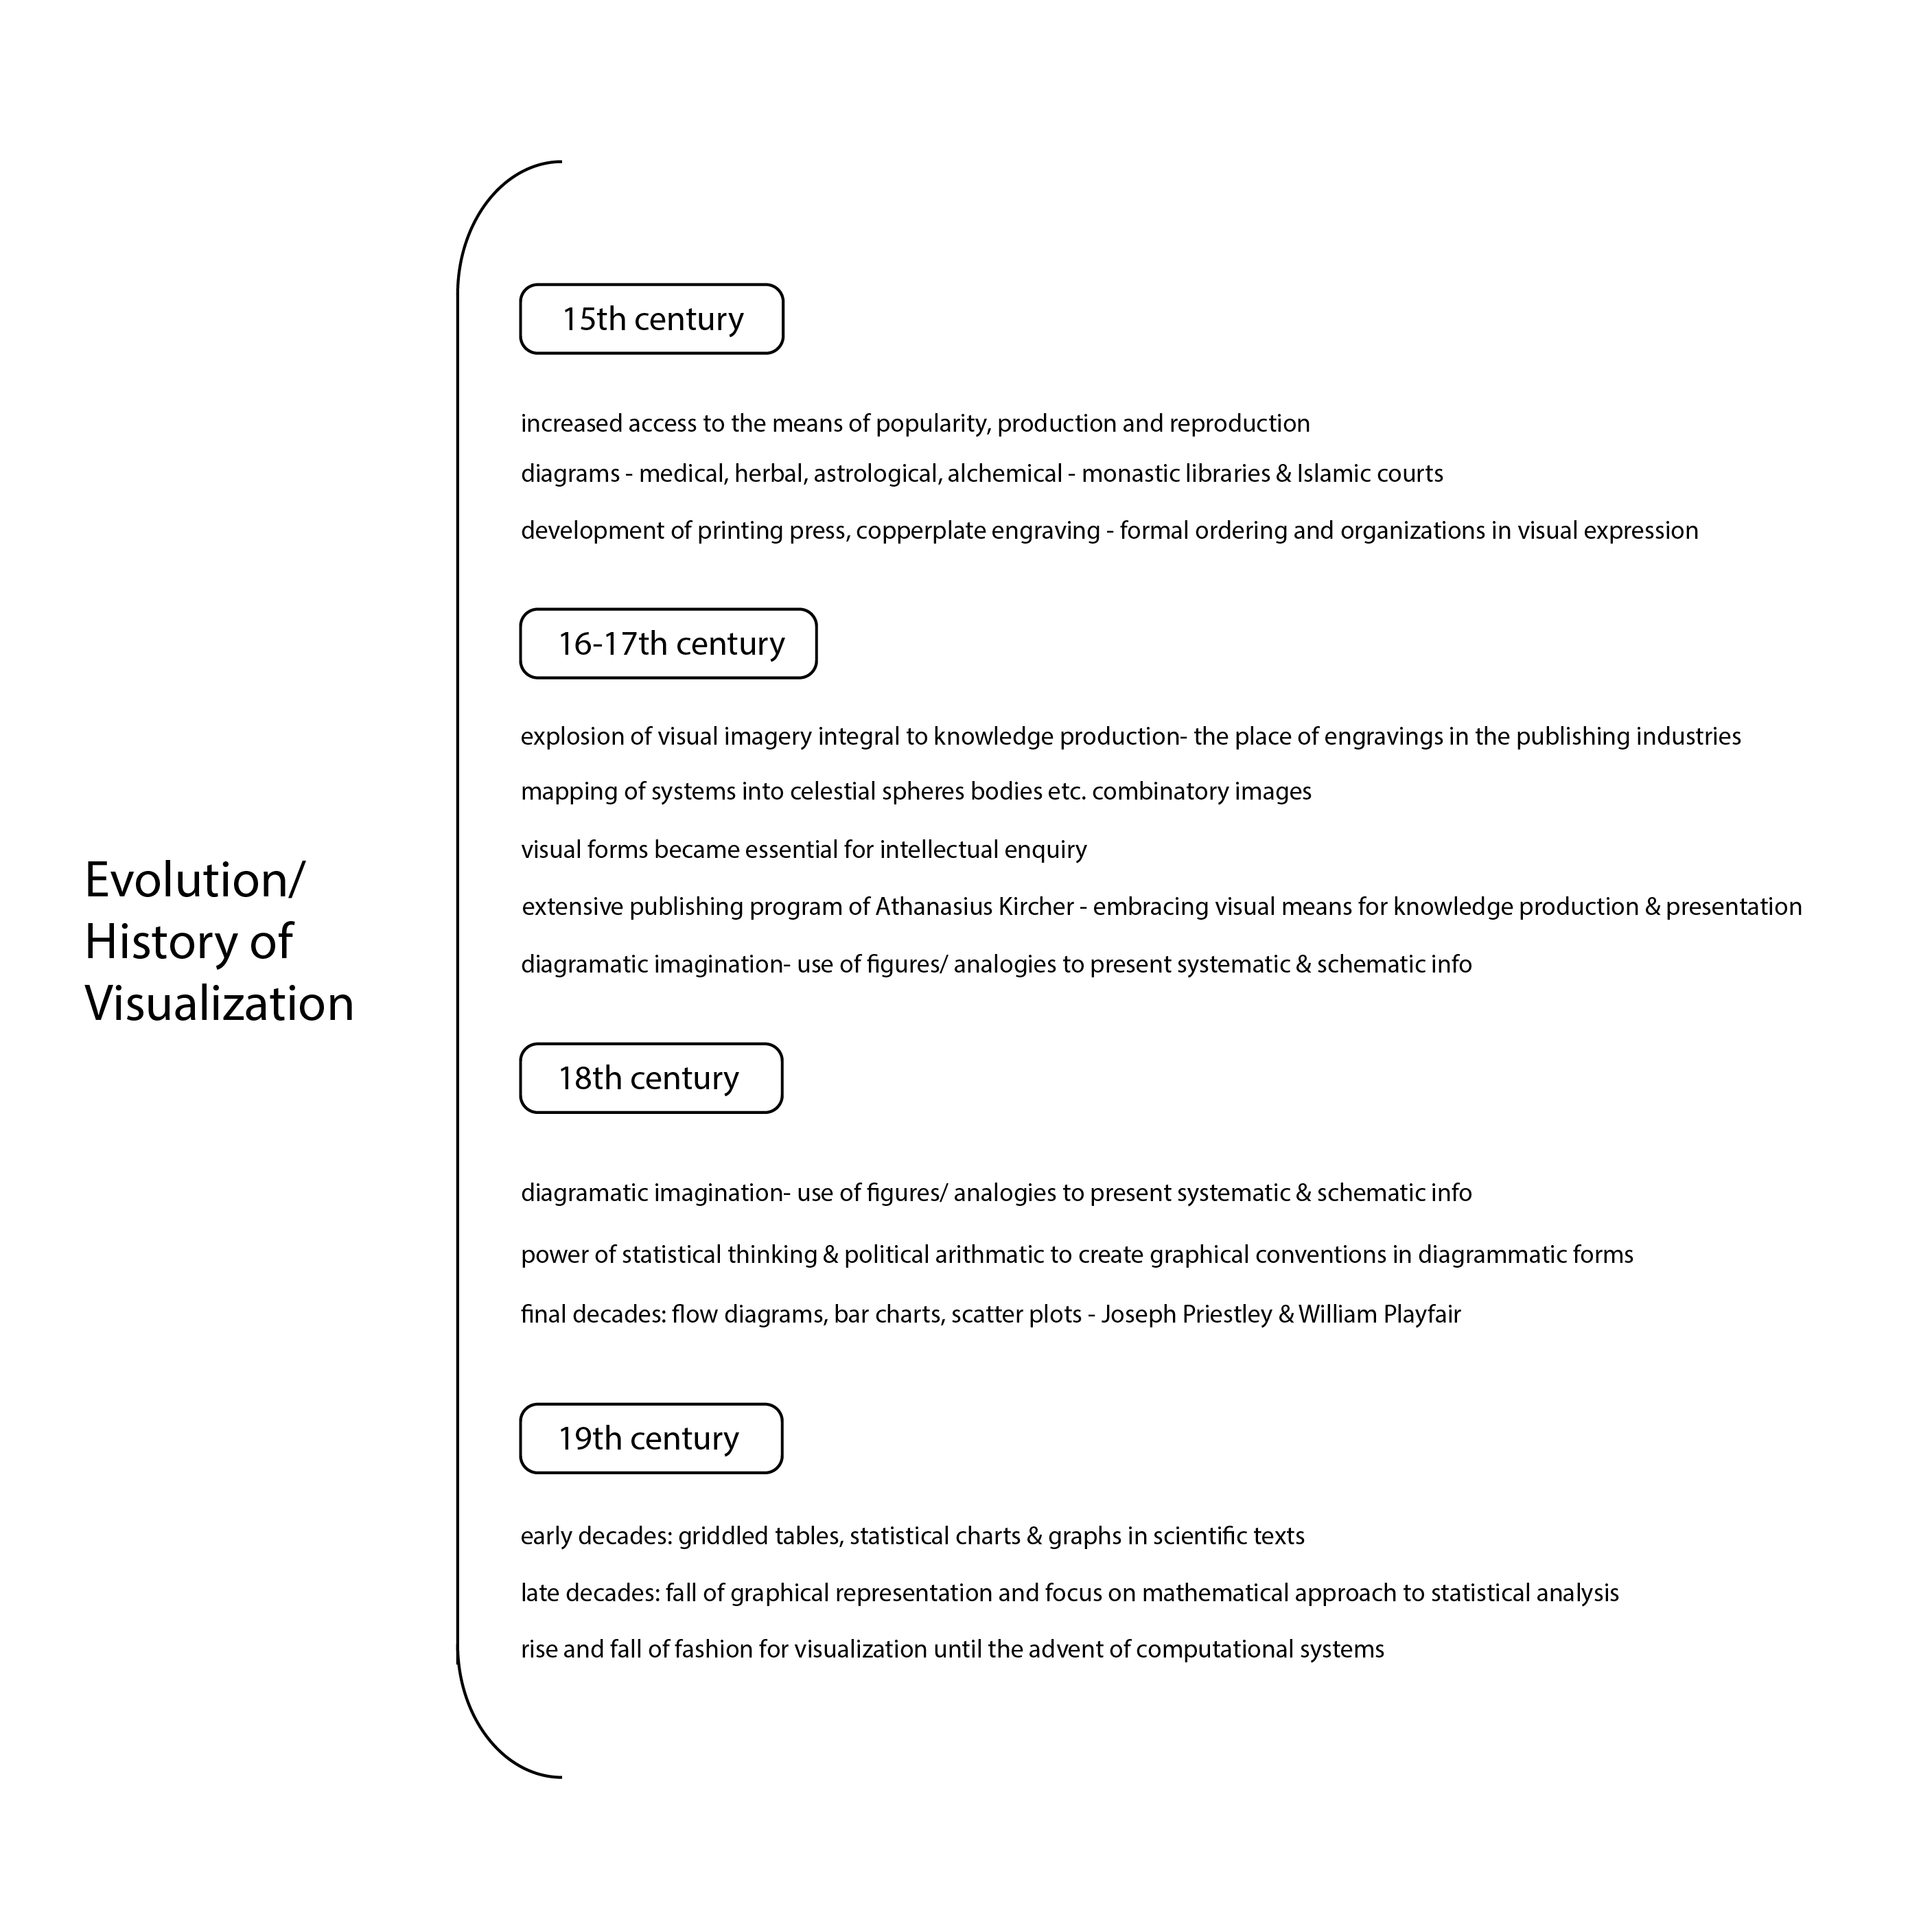
She takes us on a journey distributed among nine different fields/types/purposes of explorations in diagrammatic representations, as mentioned in the chapter, timekeeping, space-making, administration and record keeping, tree of knowledge, knowledge generators, dynamic systems, visualizing uncertainty and interpretative cartography, humanistic methods and visualizing interpretations. Attached here are some notes of points from the reading I found effective, even in some cases, for future use to come back to/ research more on:
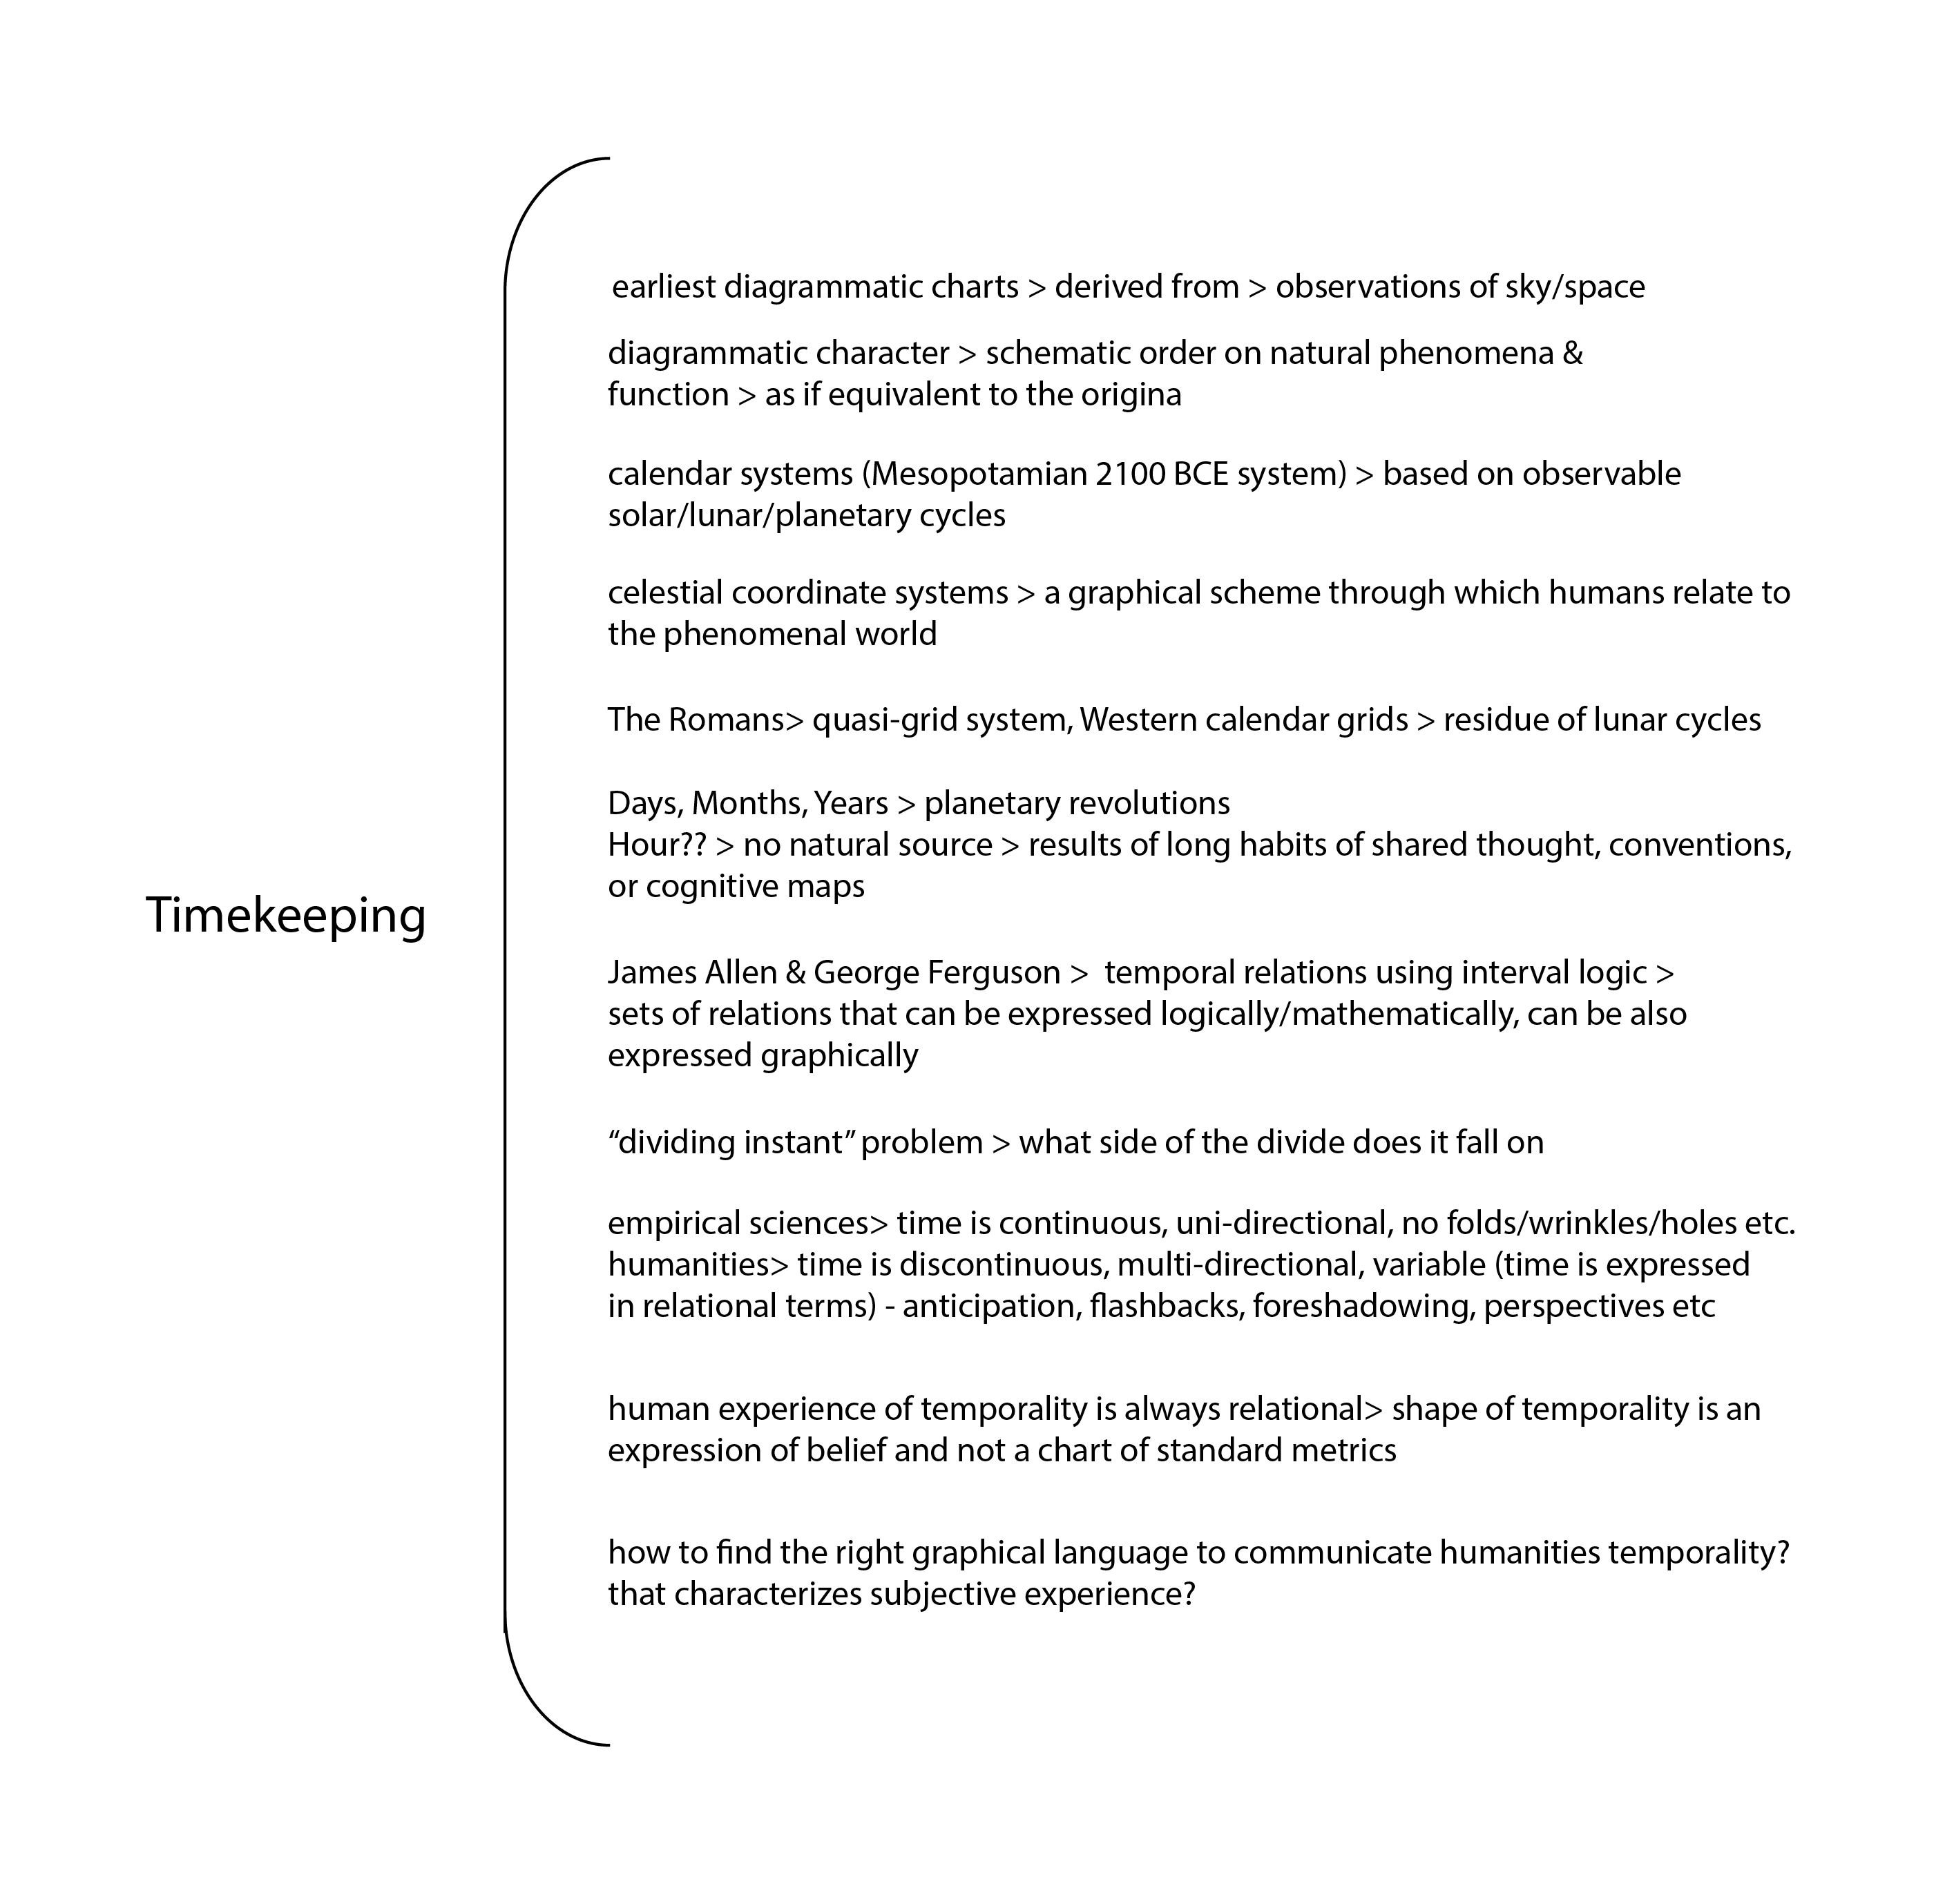
She mentions some of the great contributors in each of these areas of visual exploration, the 'why'/'what' behind their works, intentions what event lead to what event followed by what - a journey in time, a detailed build up to where we stand today in terms of visual expression. In timekeeping, she discusses the origins of the different calendar systems representing the variety of ways of interpretation and representation of time, with origins especially in celestial objects and activities:
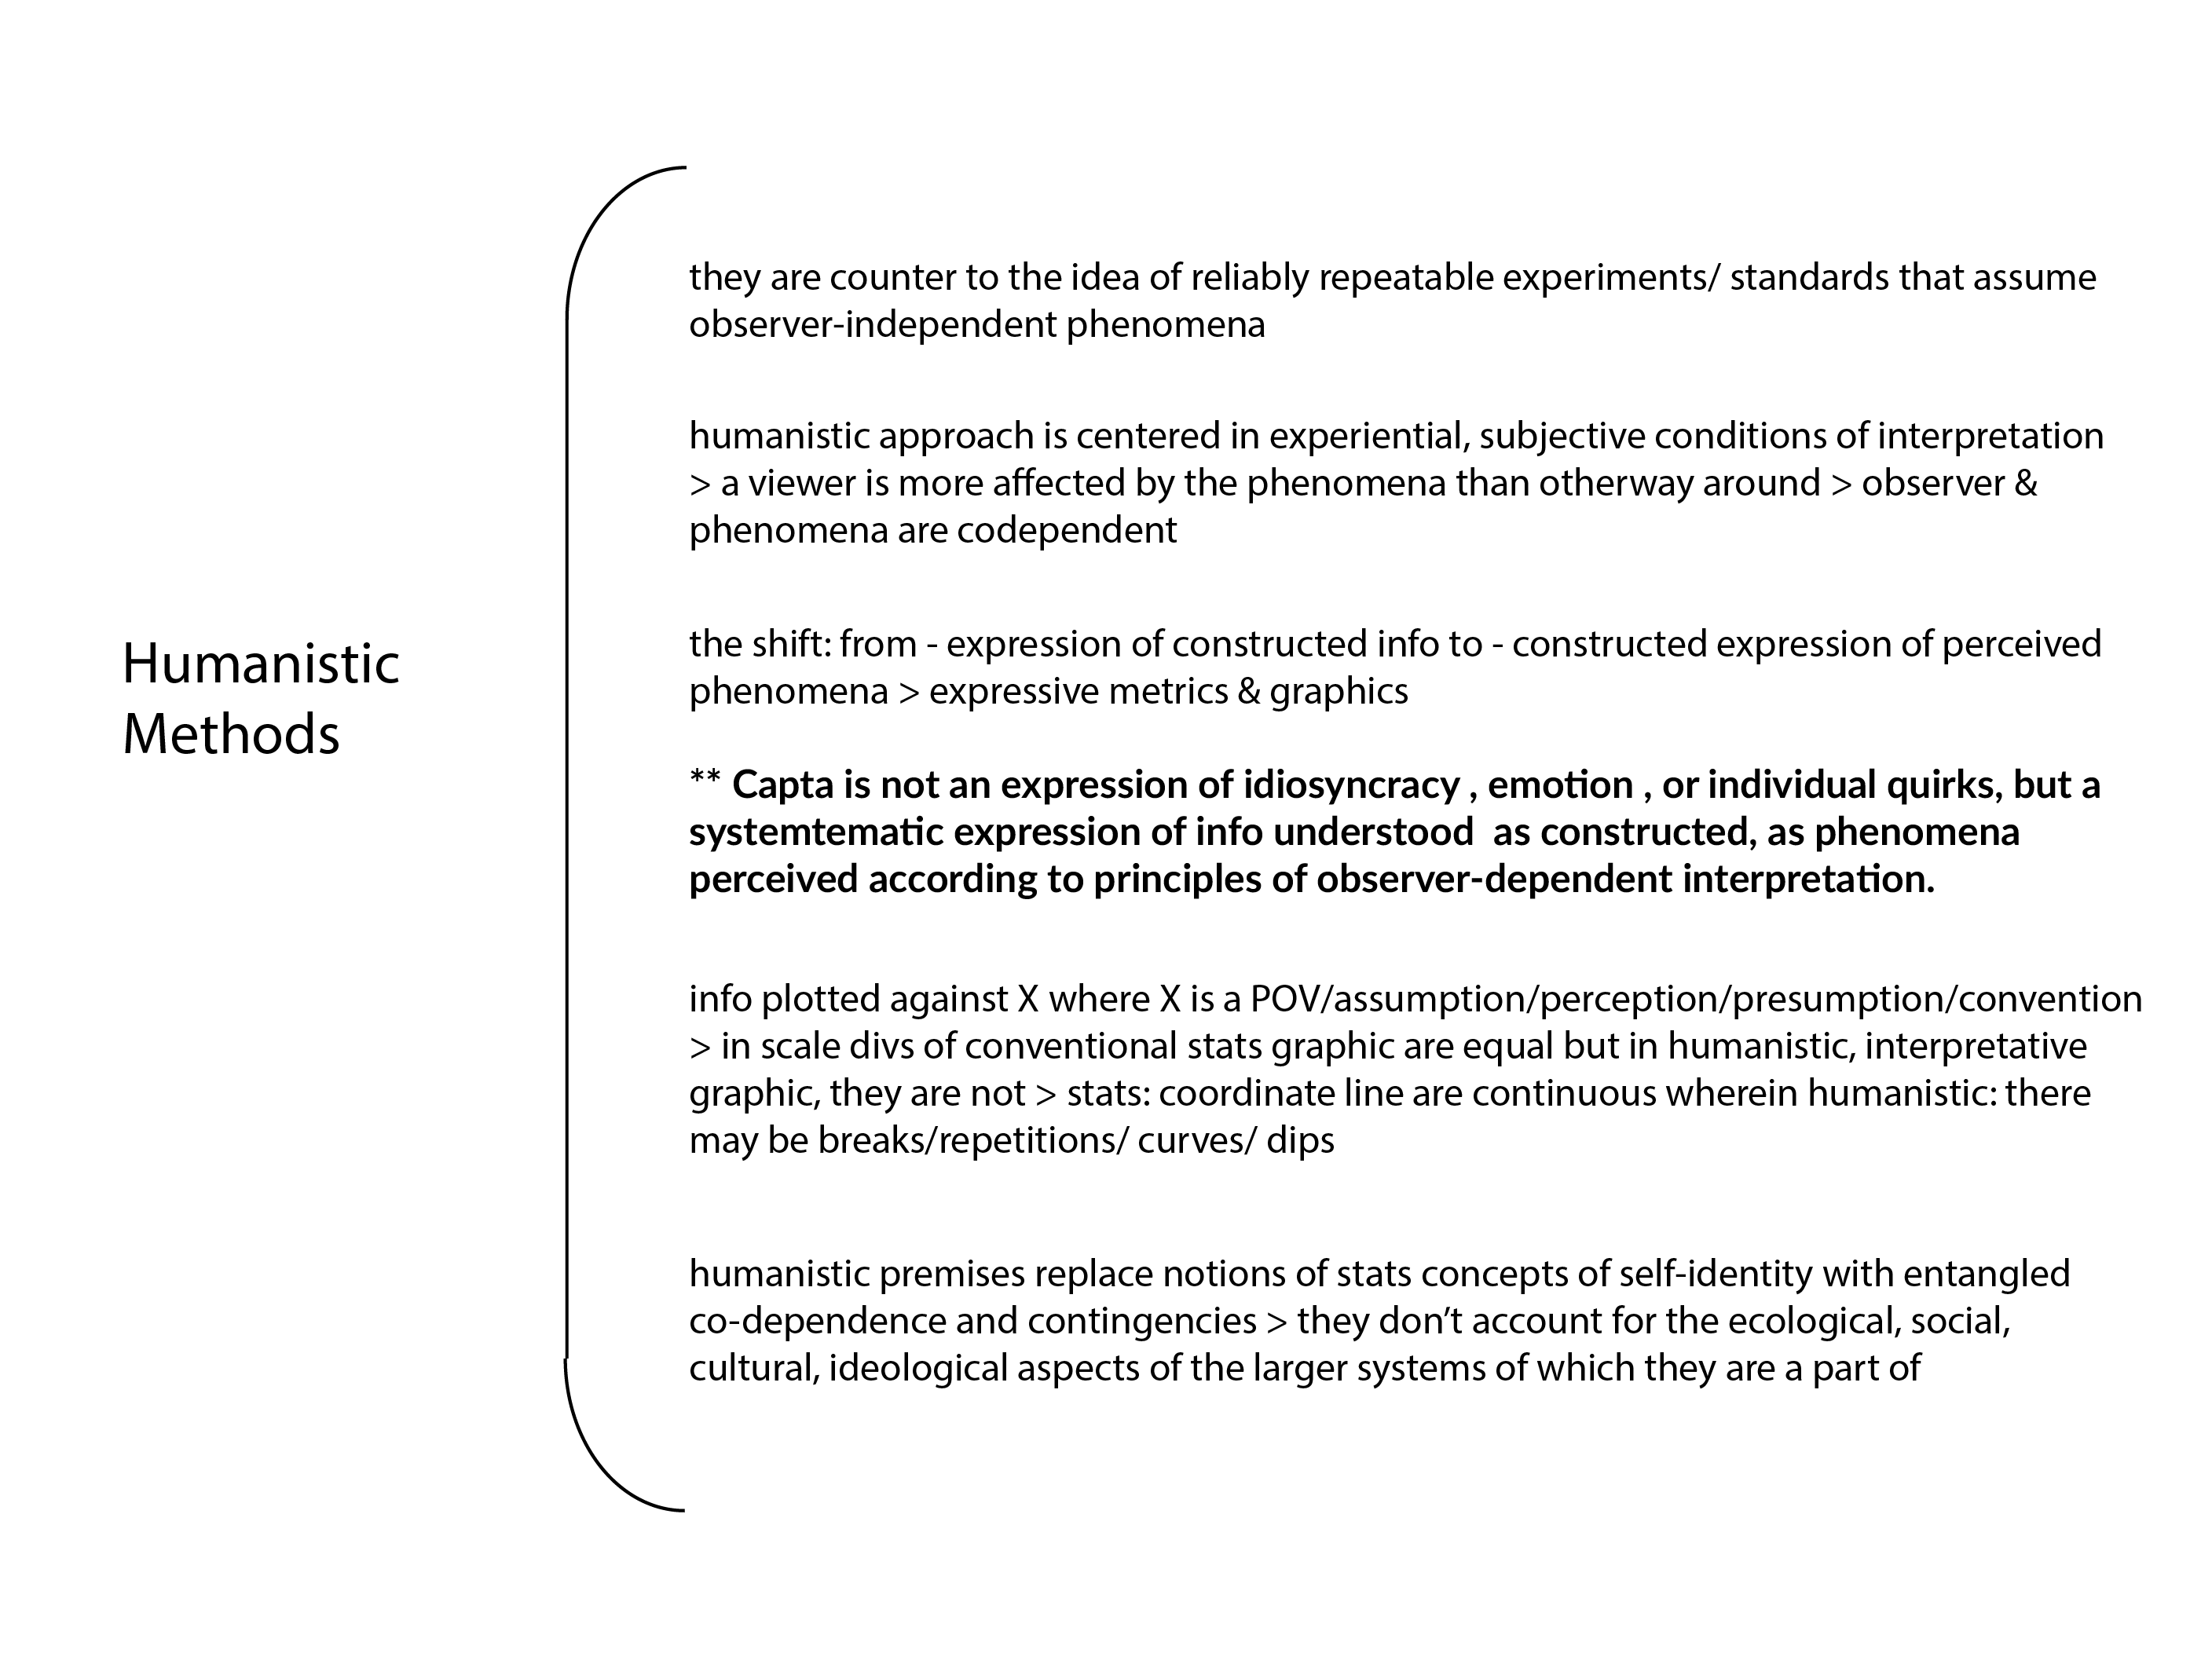
One of the points I found particularly effective (since it probably help me look at things in different light) was , in the ' Humanistic Methods' section -
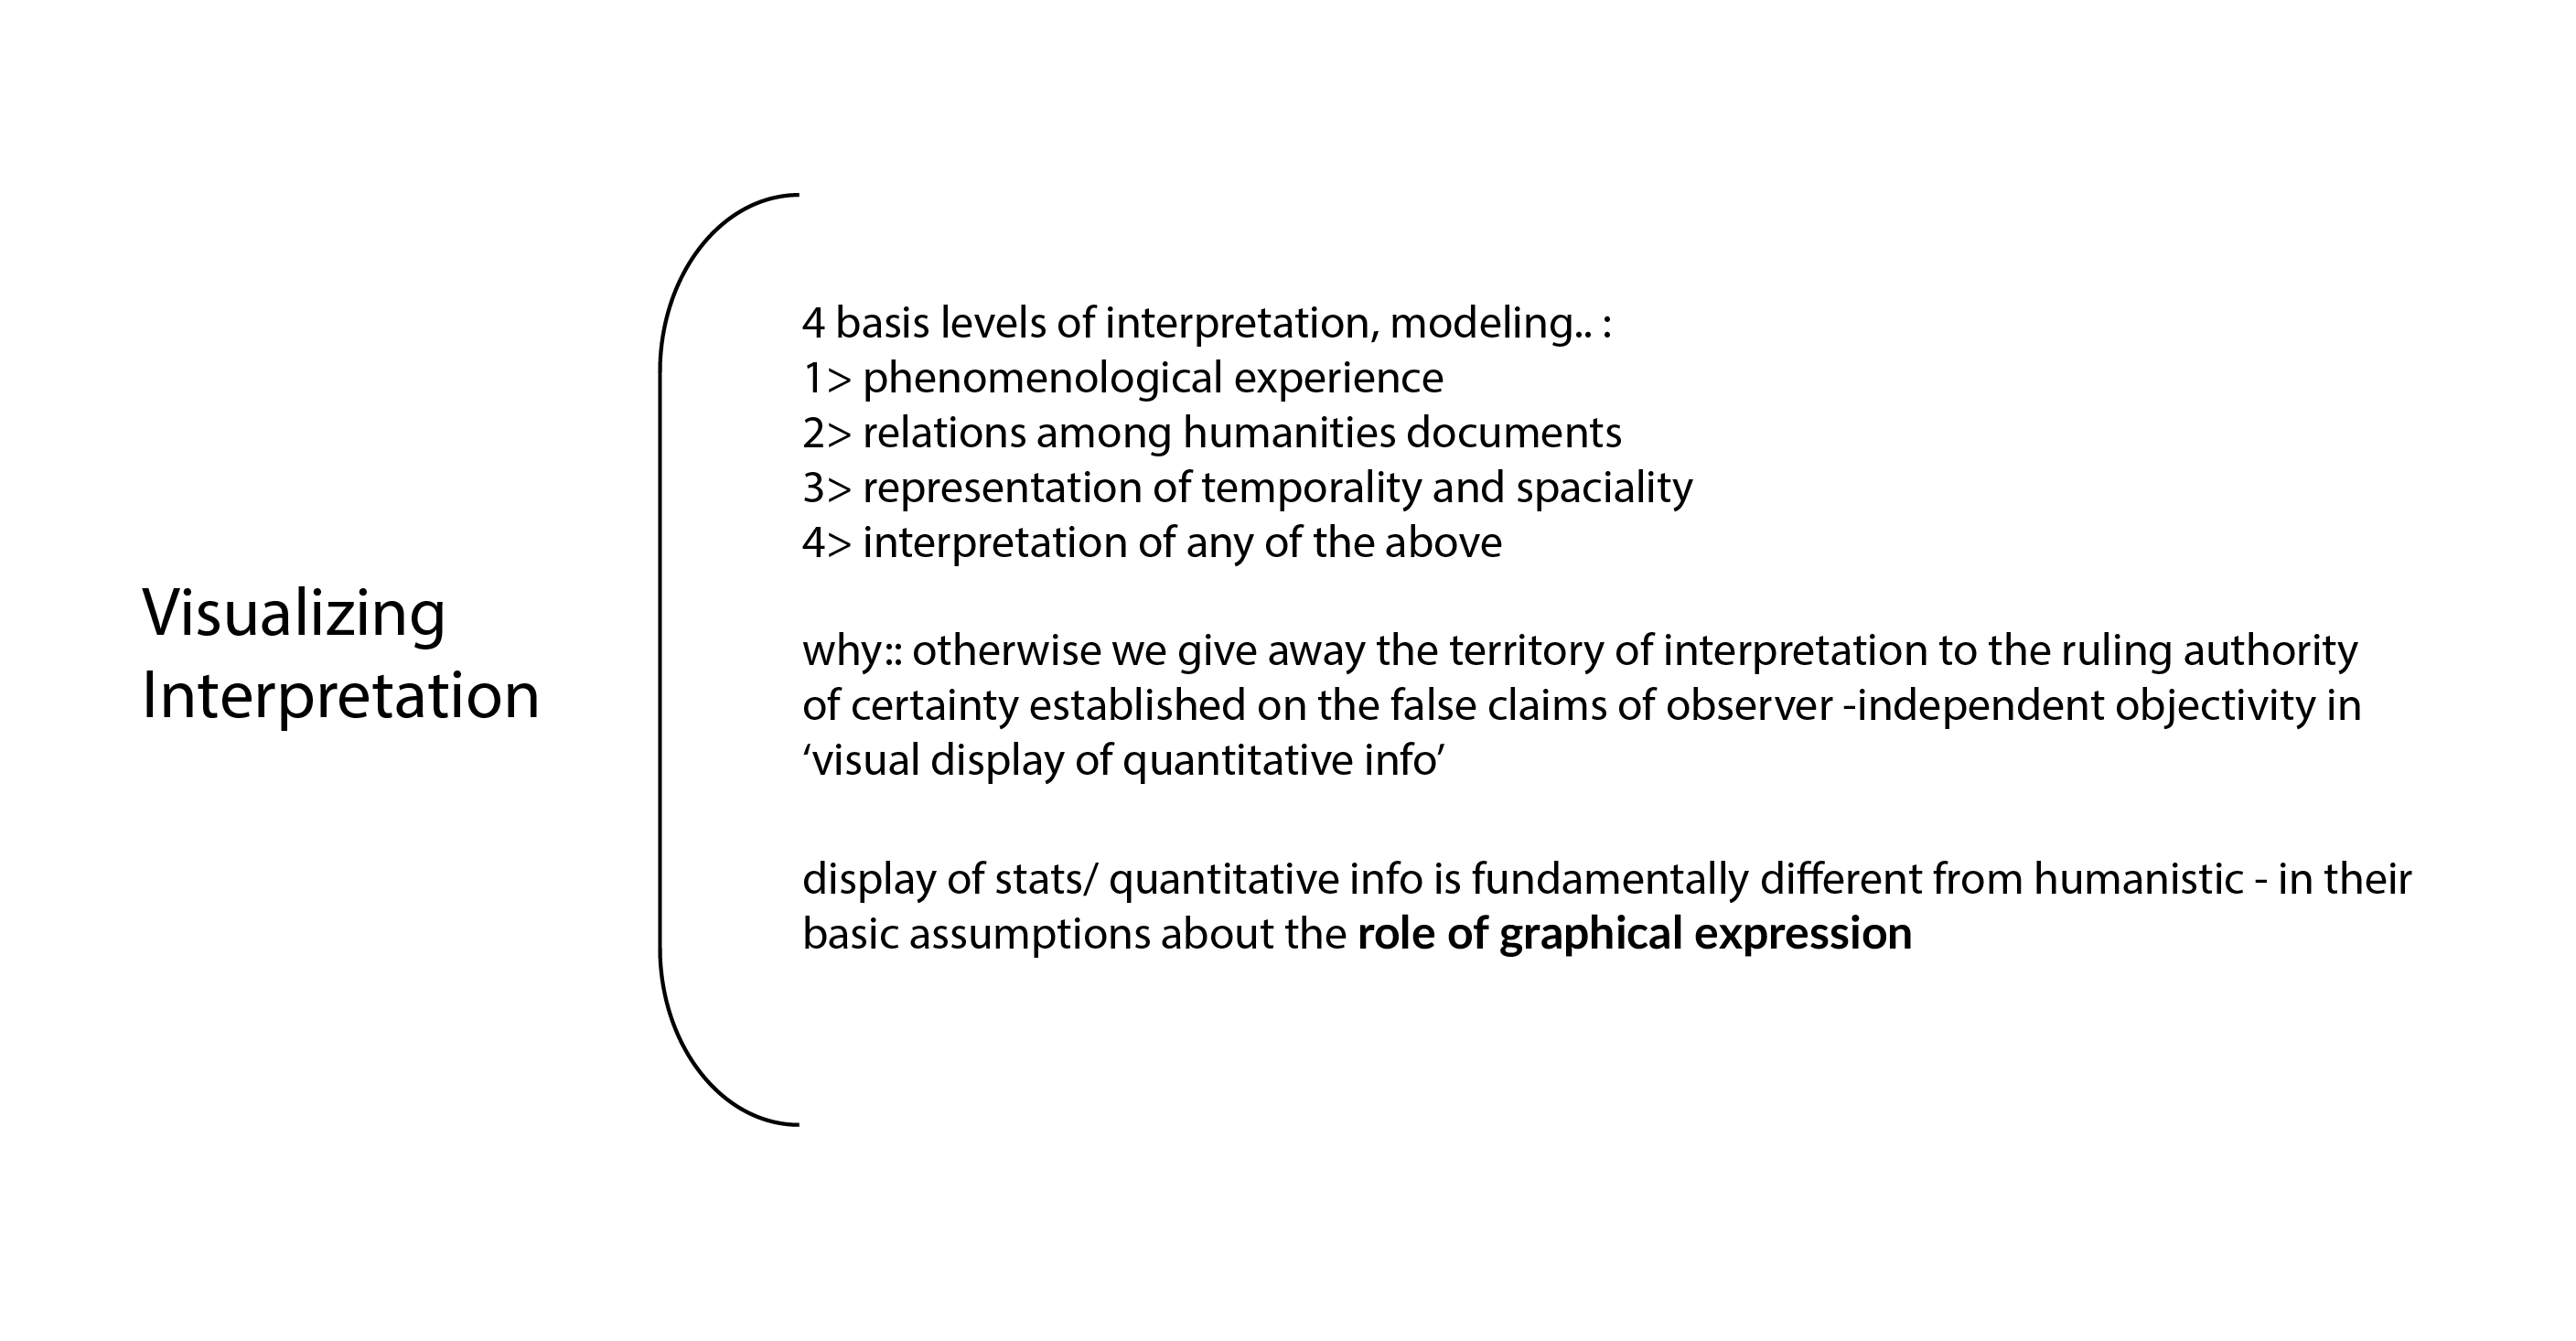
Captcha is not an expression of idiosyncrasy, emotion, or individual quirks, but a systematic expression of information understood as constructed, as phenomena perceived according to principles of observer-dependent interpretation.
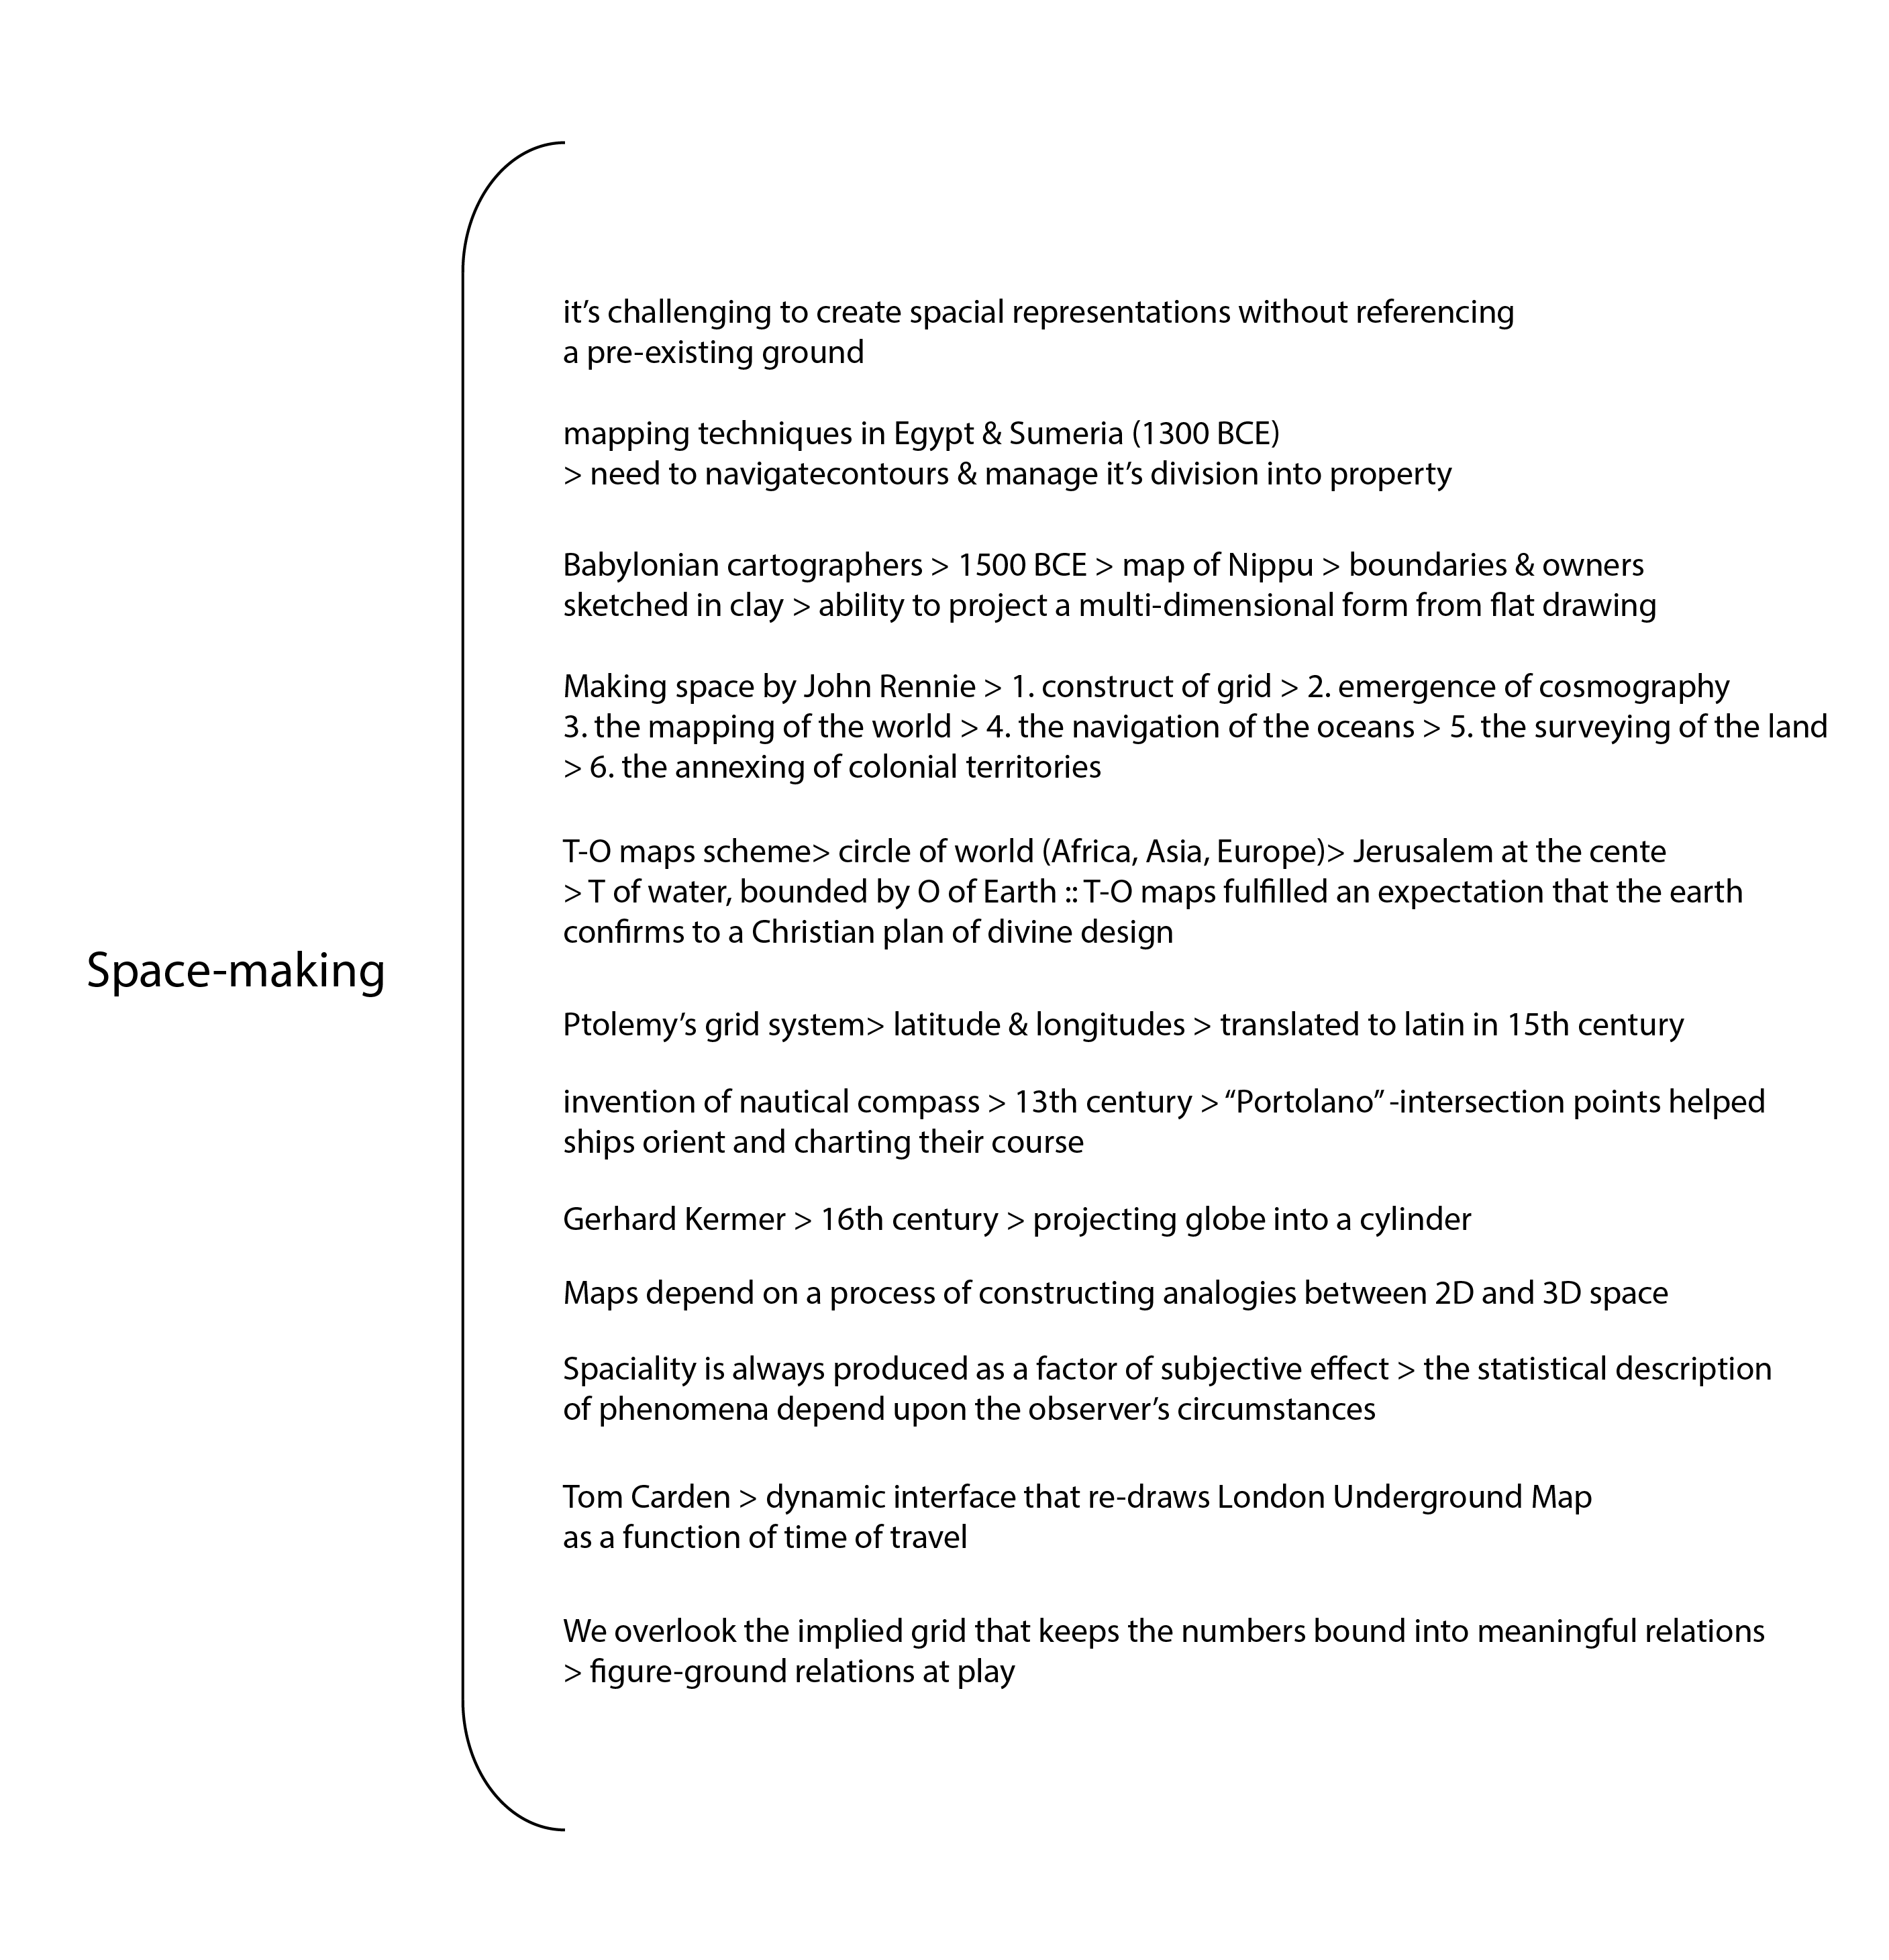
The section space-making reminded me of Einstein's theory of relativity wherein he elaborates planes of references. I remember a quote I read somewhere- "God is merely a frame of reference." I wonder if this thought was stemmed from one of the contributions to space-making. Is it too soon for humanistic thinking? Let's just keep the discussions to scientific representations of space such as coordinate systems, frames of reference, shape of the world and what connects humans to God.
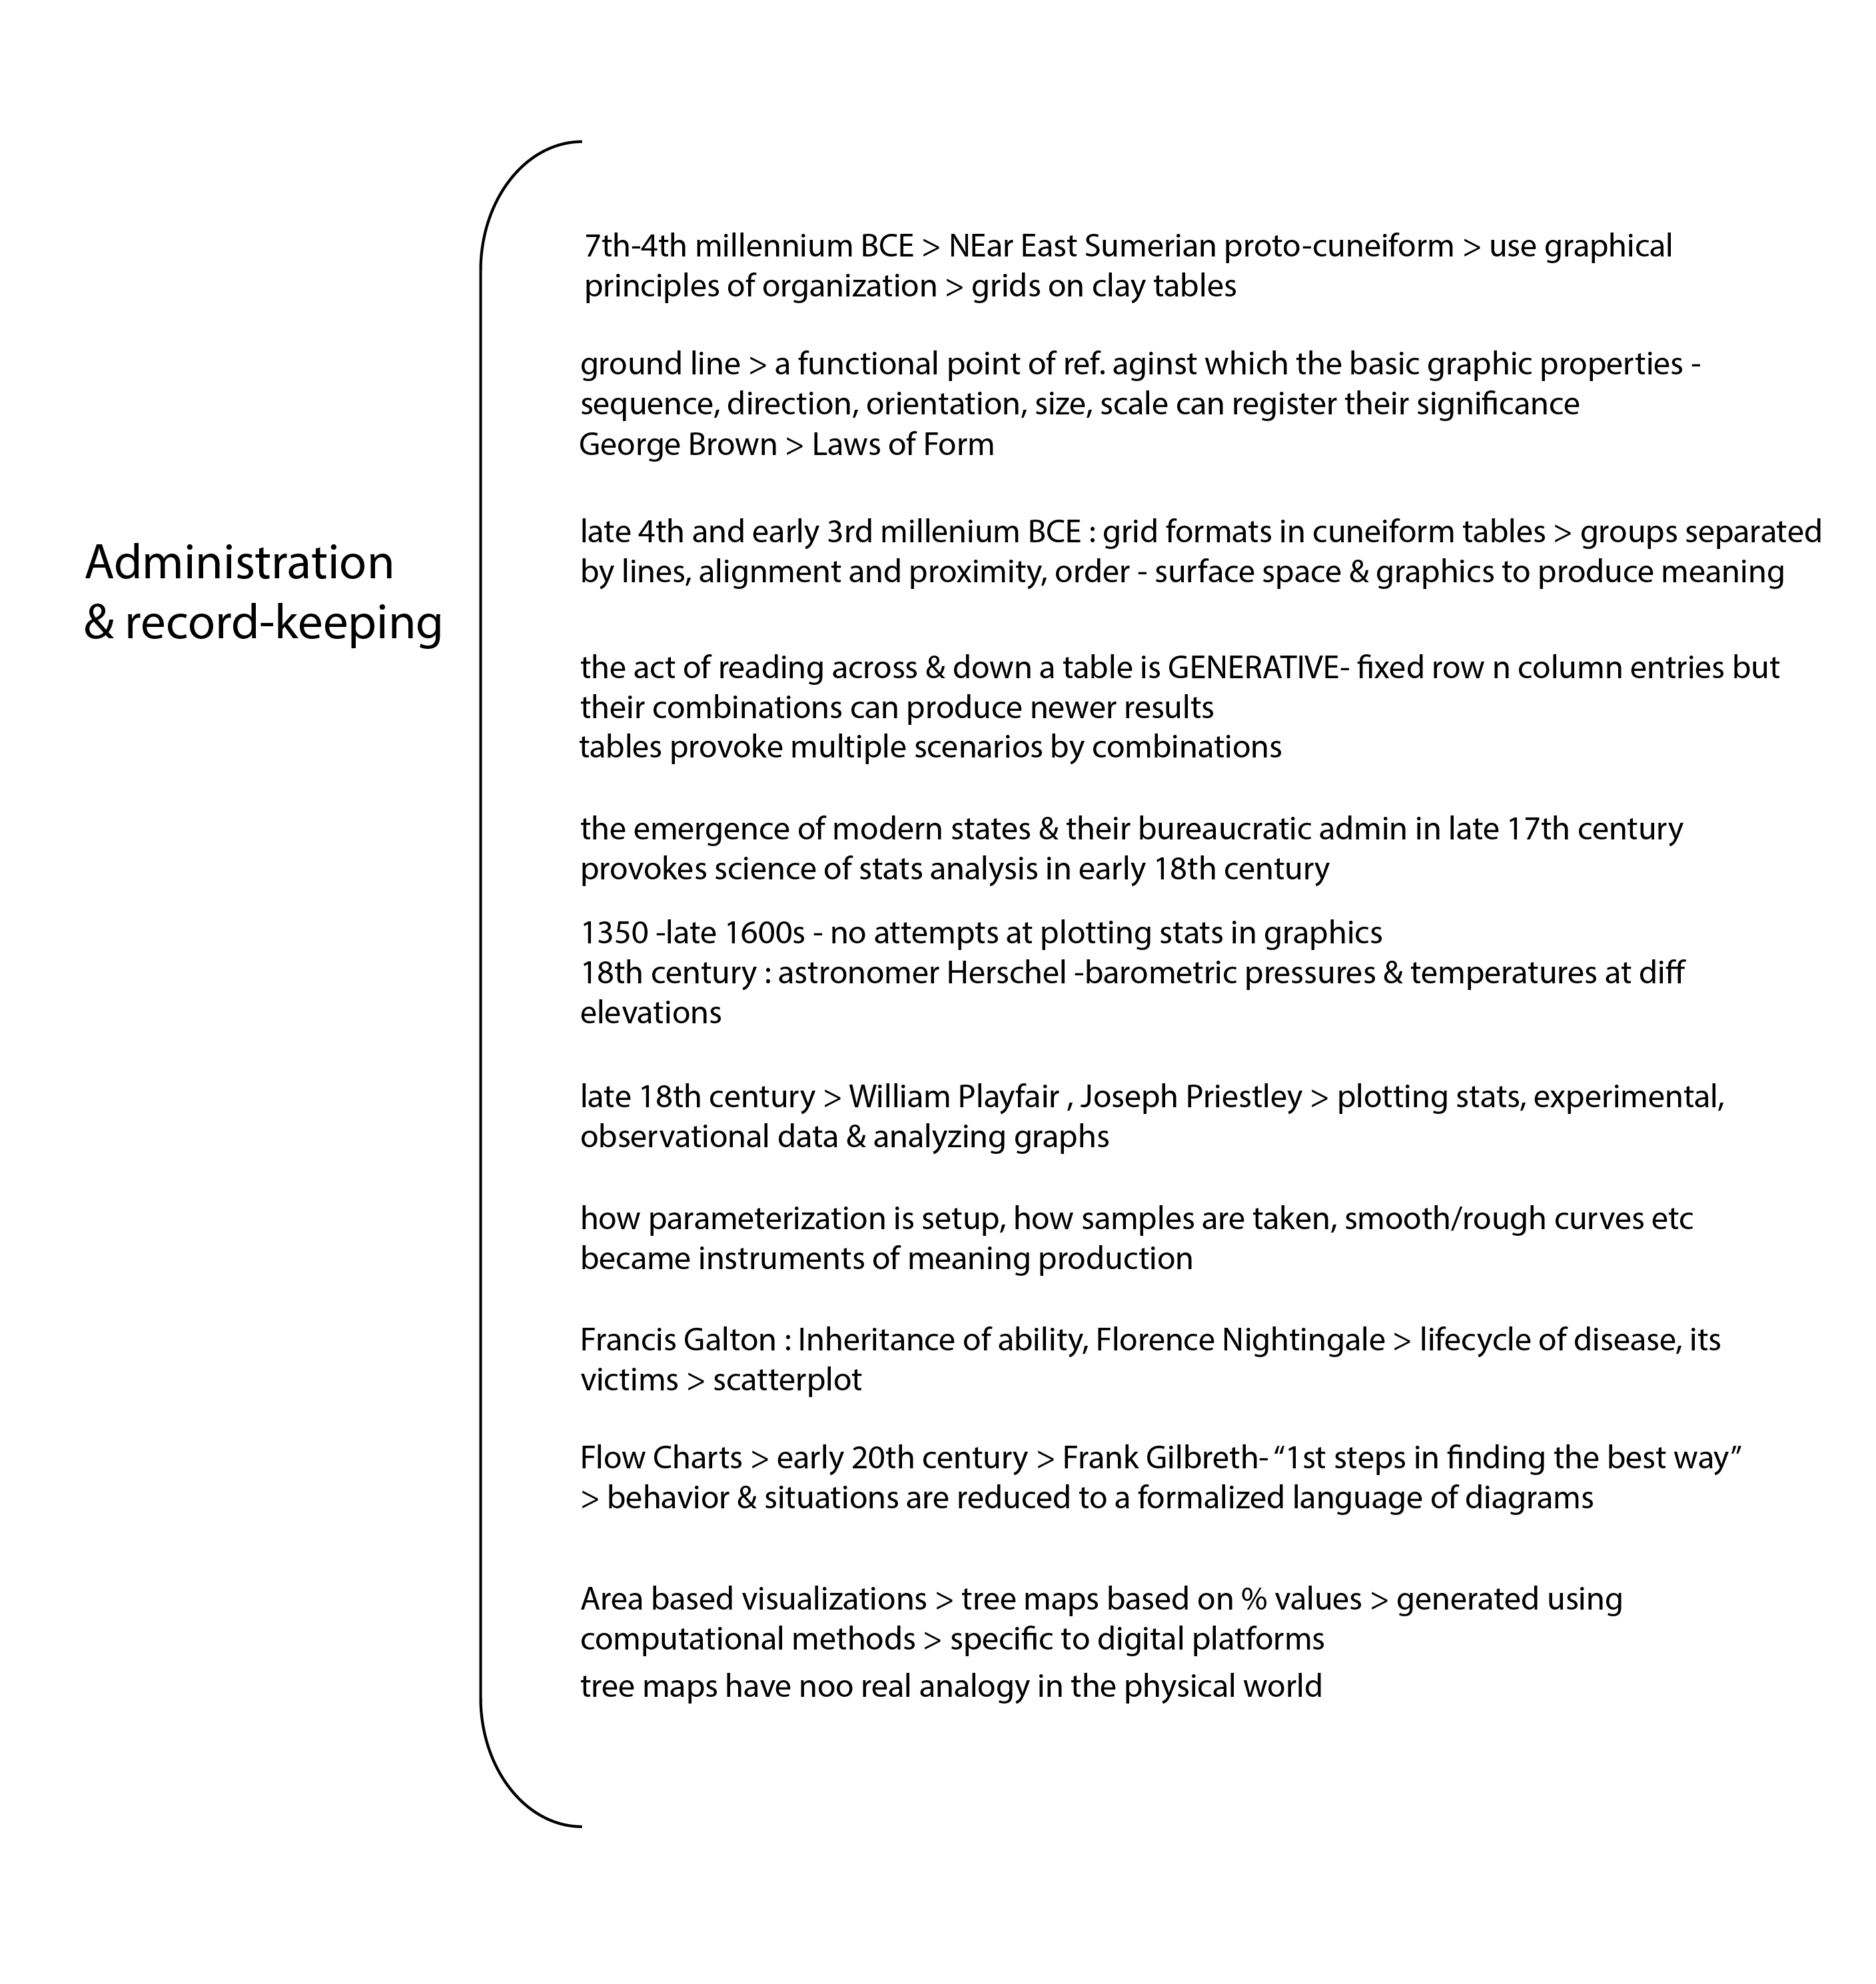
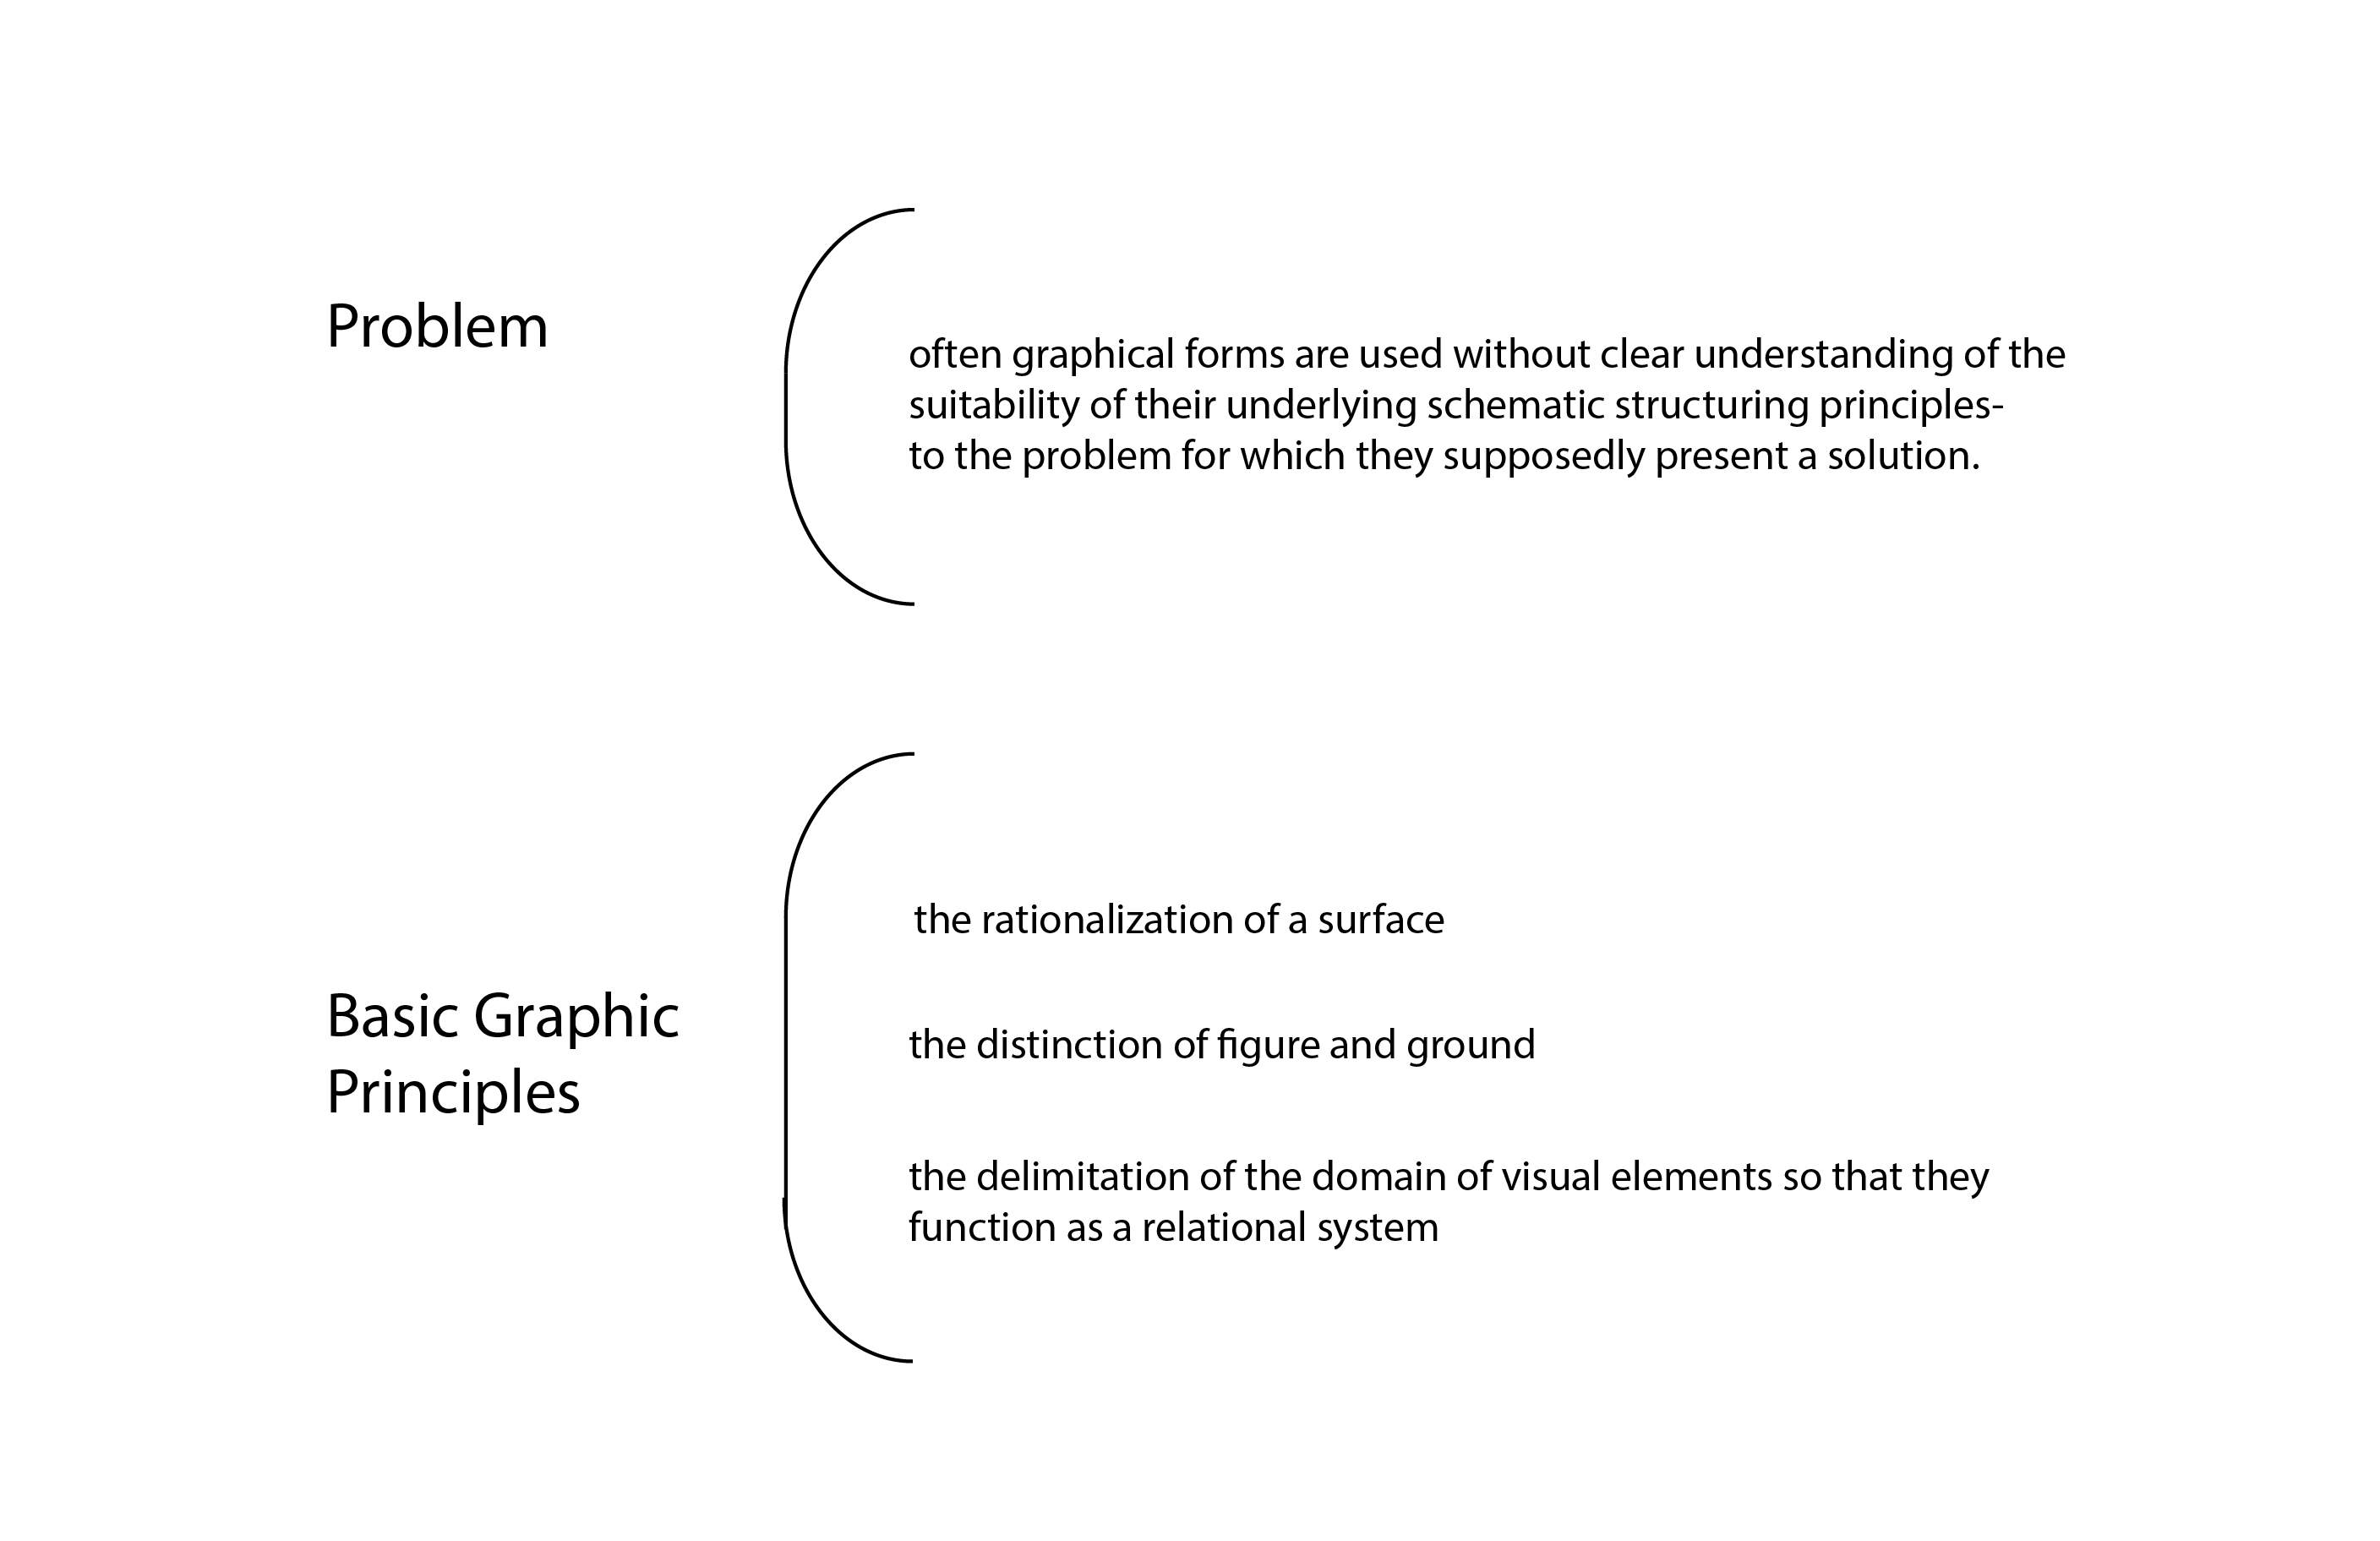
What I find interesting from this section is the idea that we take tables for granted, because they are so widely used. Tables, with its rows and columns actually organize/group information which is already a major contribution towards diagrammatic representation and an accurate example of the concept of figure and ground. We are already putting info in a certain structure, helping us well enough to comprehend it in a better way. Hence, tables can also be considered as a diagrammatic representation of information.
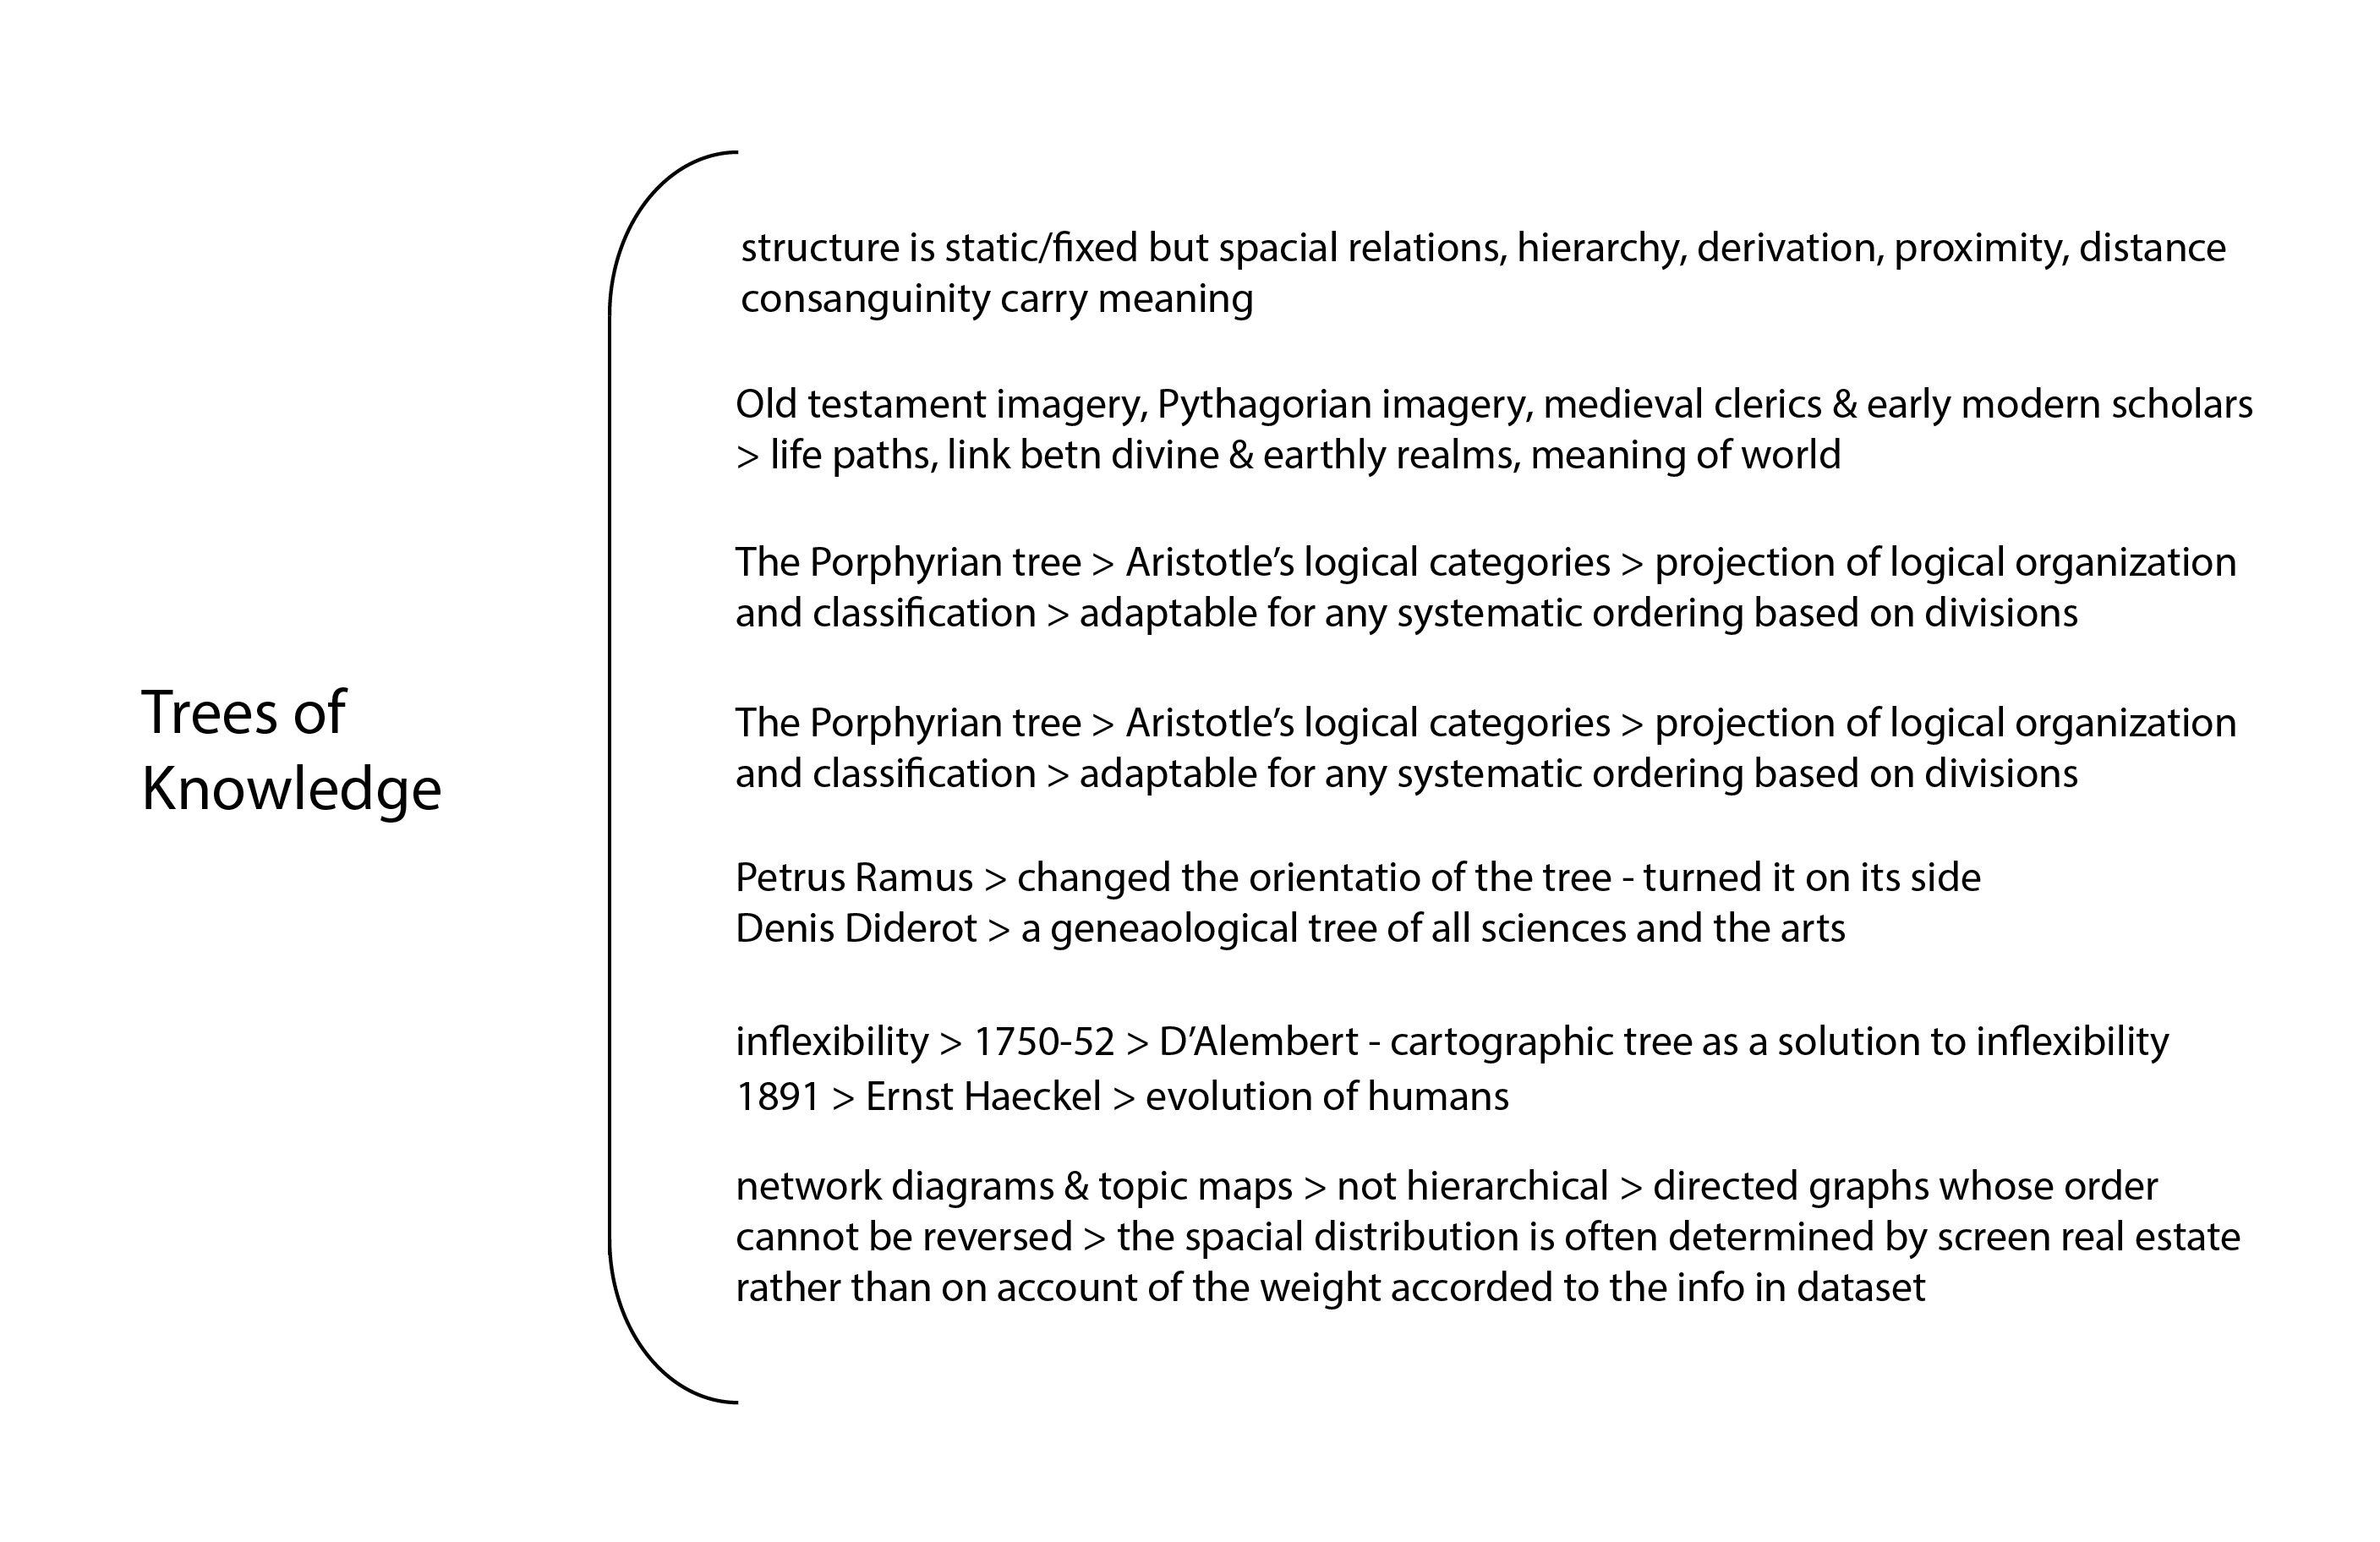
Trees of knowledge are static structures well equipped to represent hierarchical information. The spacial distances and positioning of the entities in a tree structure establishes the relationship in this graphical representation. Although, due to their static nature, they have limitations or could be called "inflexible", they are one directional (and the direction of the connection cannot be reversed).
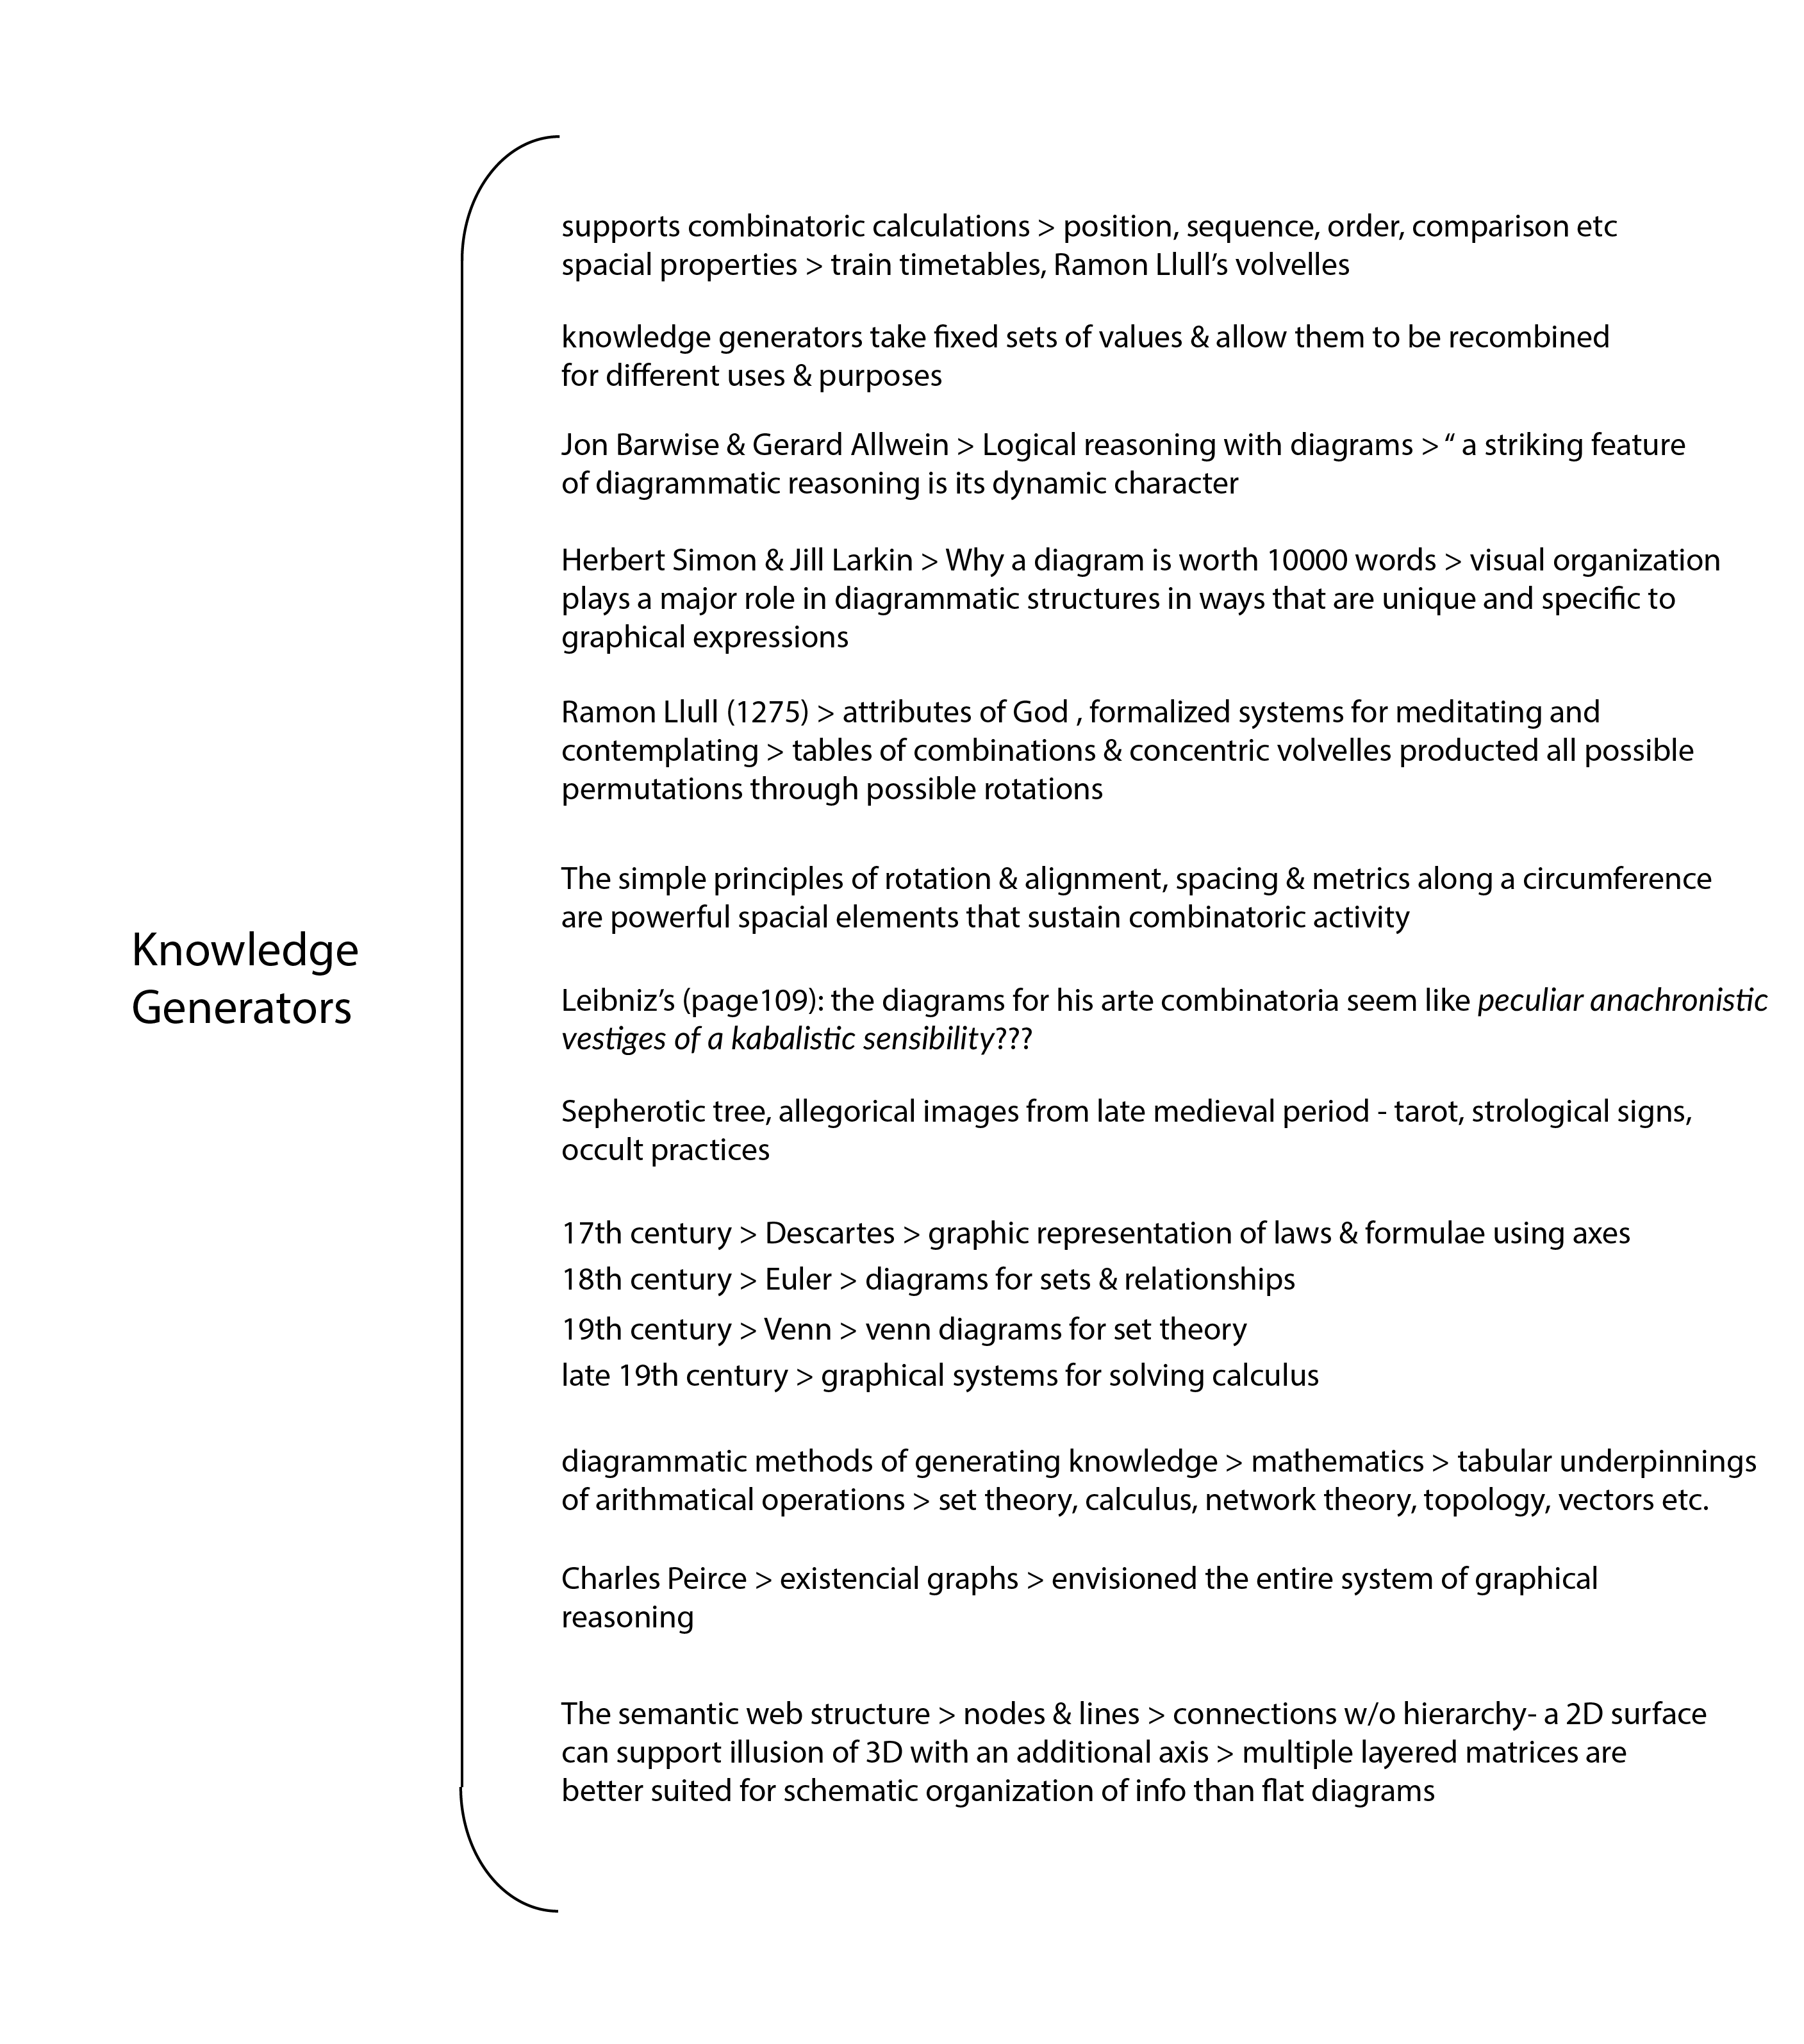
Knowledge generators are flexible unlike trees. One can have different variables interact with each-other and produce unexpected combinations as a result of it. Some of the contributions mentioned in this section are very interesting, although, due to limited time I could not deep dive into understanding them at the moment. Knowledge generators are based on mathematics- permutations, combinations. Although, I feel it goes both ways, diagrammatic representation of the mathematical results or other way around.
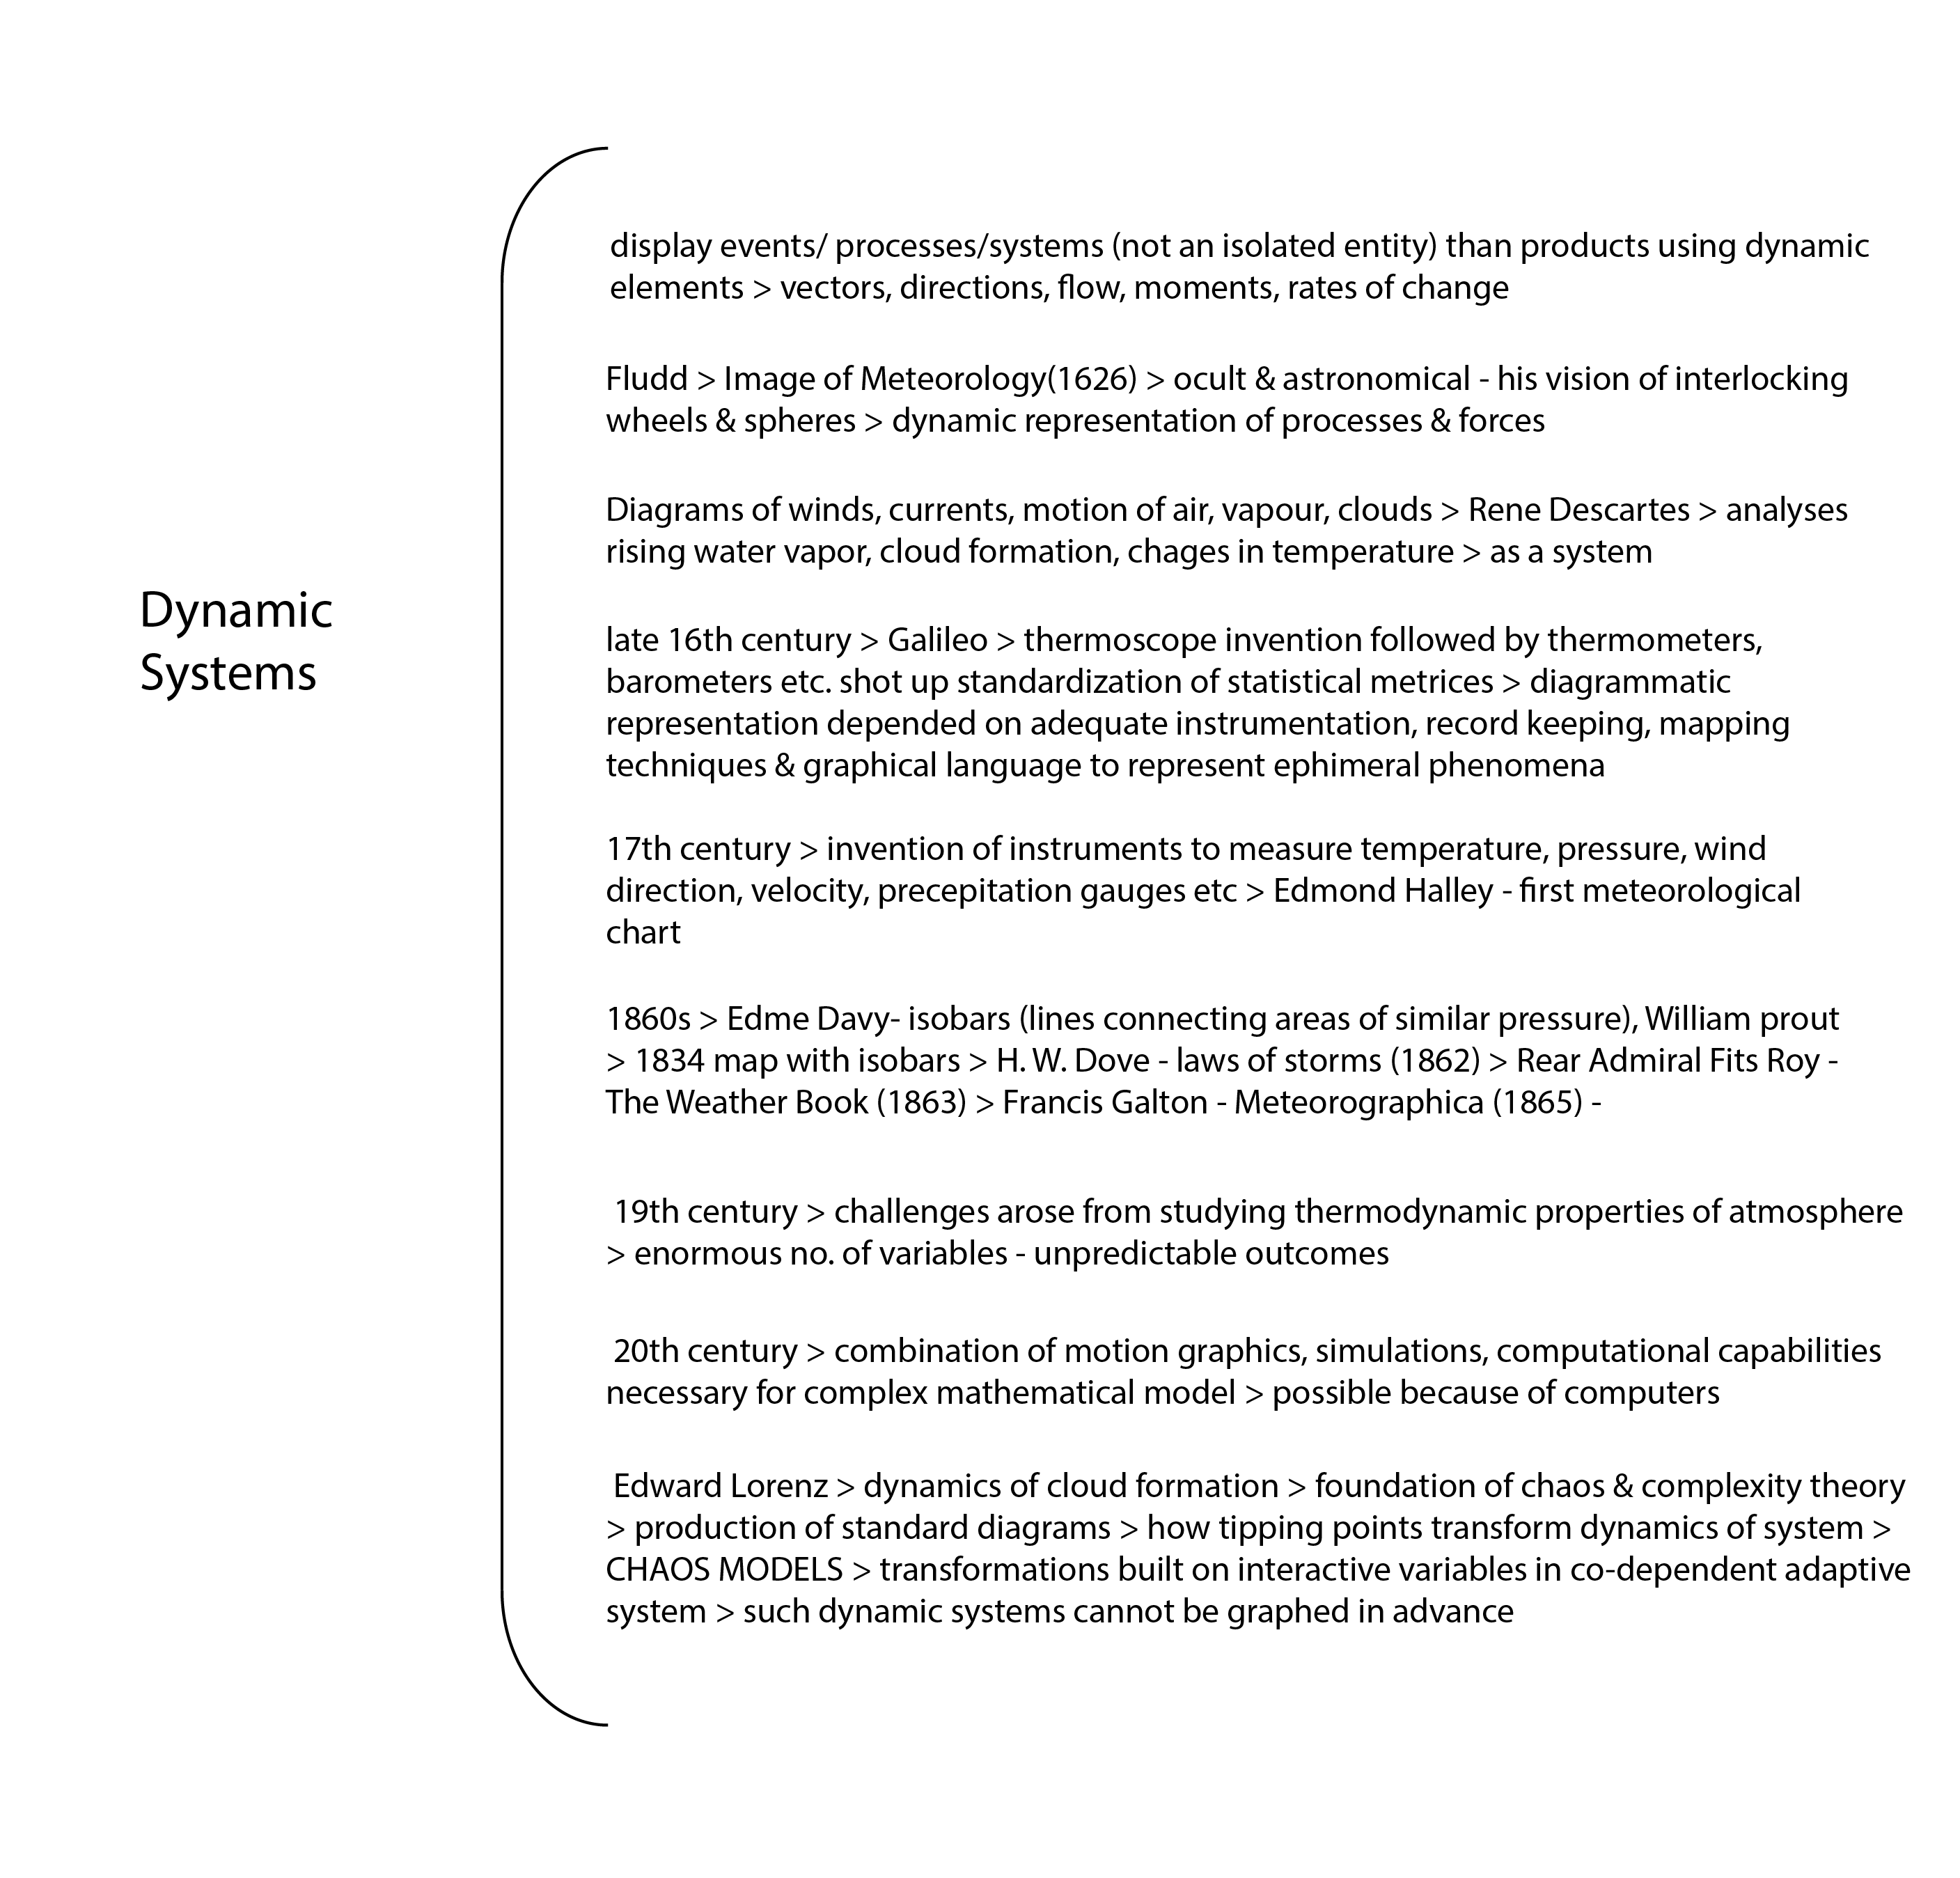
Dynamic systems are basically built around the concepts of representational system/ processes/ events (carefully note that it's not a single relation/entity it's the entire system) - mostly continually varying events such as motion of water, air currents, clouds, direction chaos, pressure etc. With the invent of the instruments to measure such events, it became a necessity to express the measurements diagrammatically with vectors.
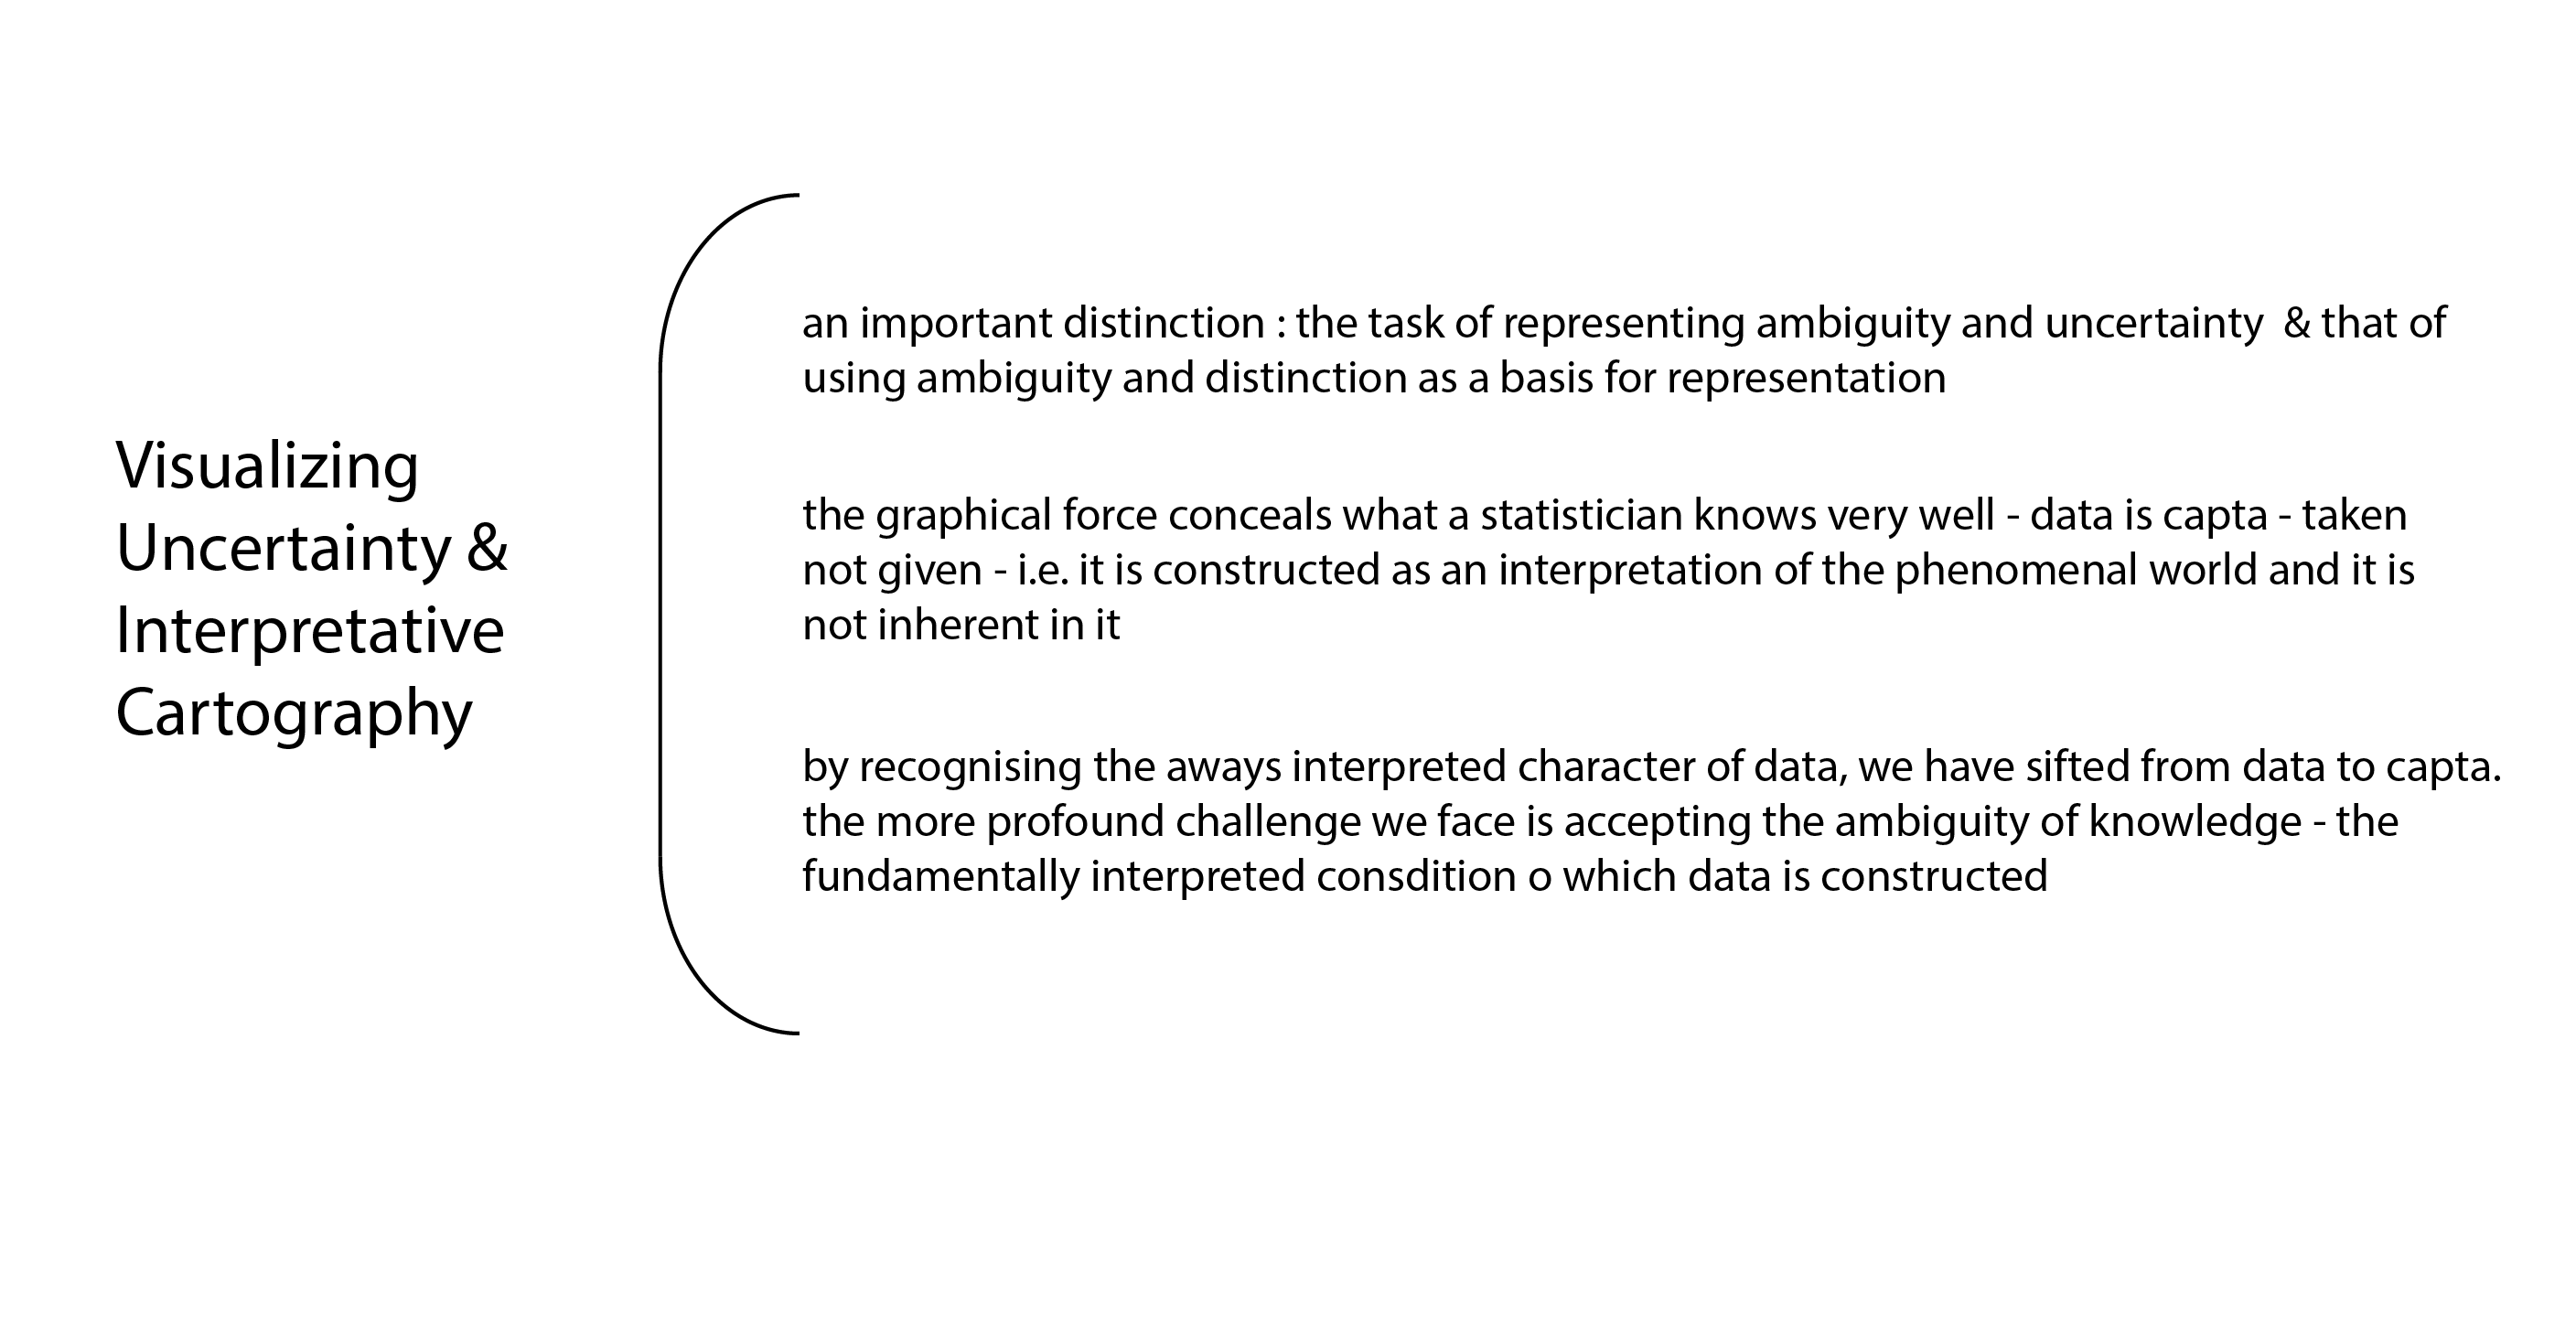
I could not understand this section very well. But my big take away at the moment would be: Data is Capta. Its something that's captured/measures from the real world events (phenomena). Hence data is a construct. A statistician knows this very well but graphical force does not reveal it efficiently.
After reading this section, it felt that there are two major approaches to the interpretations & representations- statistical and humanistic. The former primarily deals with the representation of quantitative data (which is as stated in the reading, a construct taken from the real world with an assumption of objectivity /observer- independent observation) and later with all kinds of subjective considerations.