- Description
Arc diagrams are two dimensional informative network graph. It constitutes of two elements i.e. node and links.
1.1. Nodes
Nodes represents the entities of the data. It is presented in a single line usually on a horizontal axis. Further information or details can be translated into the nodes by manipulating the radius of the nodes.
1.2. Links
Arcs are used as links intended to show relationships between the nodes. Variations of wide arcs or arc line-width can be used to add details such as type or frequency of connection between entities.
2. Aspects
2.1. Advantage
Arc Diagrams are ideal for visualizing networks, connections between different entities of information and the study the distribution of the connections.
2.2. Disadvantage
Arc diagrams are not ideal to show the exact structure or connection between the nodes.
Increase in number of links might make the diagram over cluttered to fetch precise connections and structure of the entities.
3. Examples
Good Examples
3.1. Visualizing the Papers of Thomas Jefferson
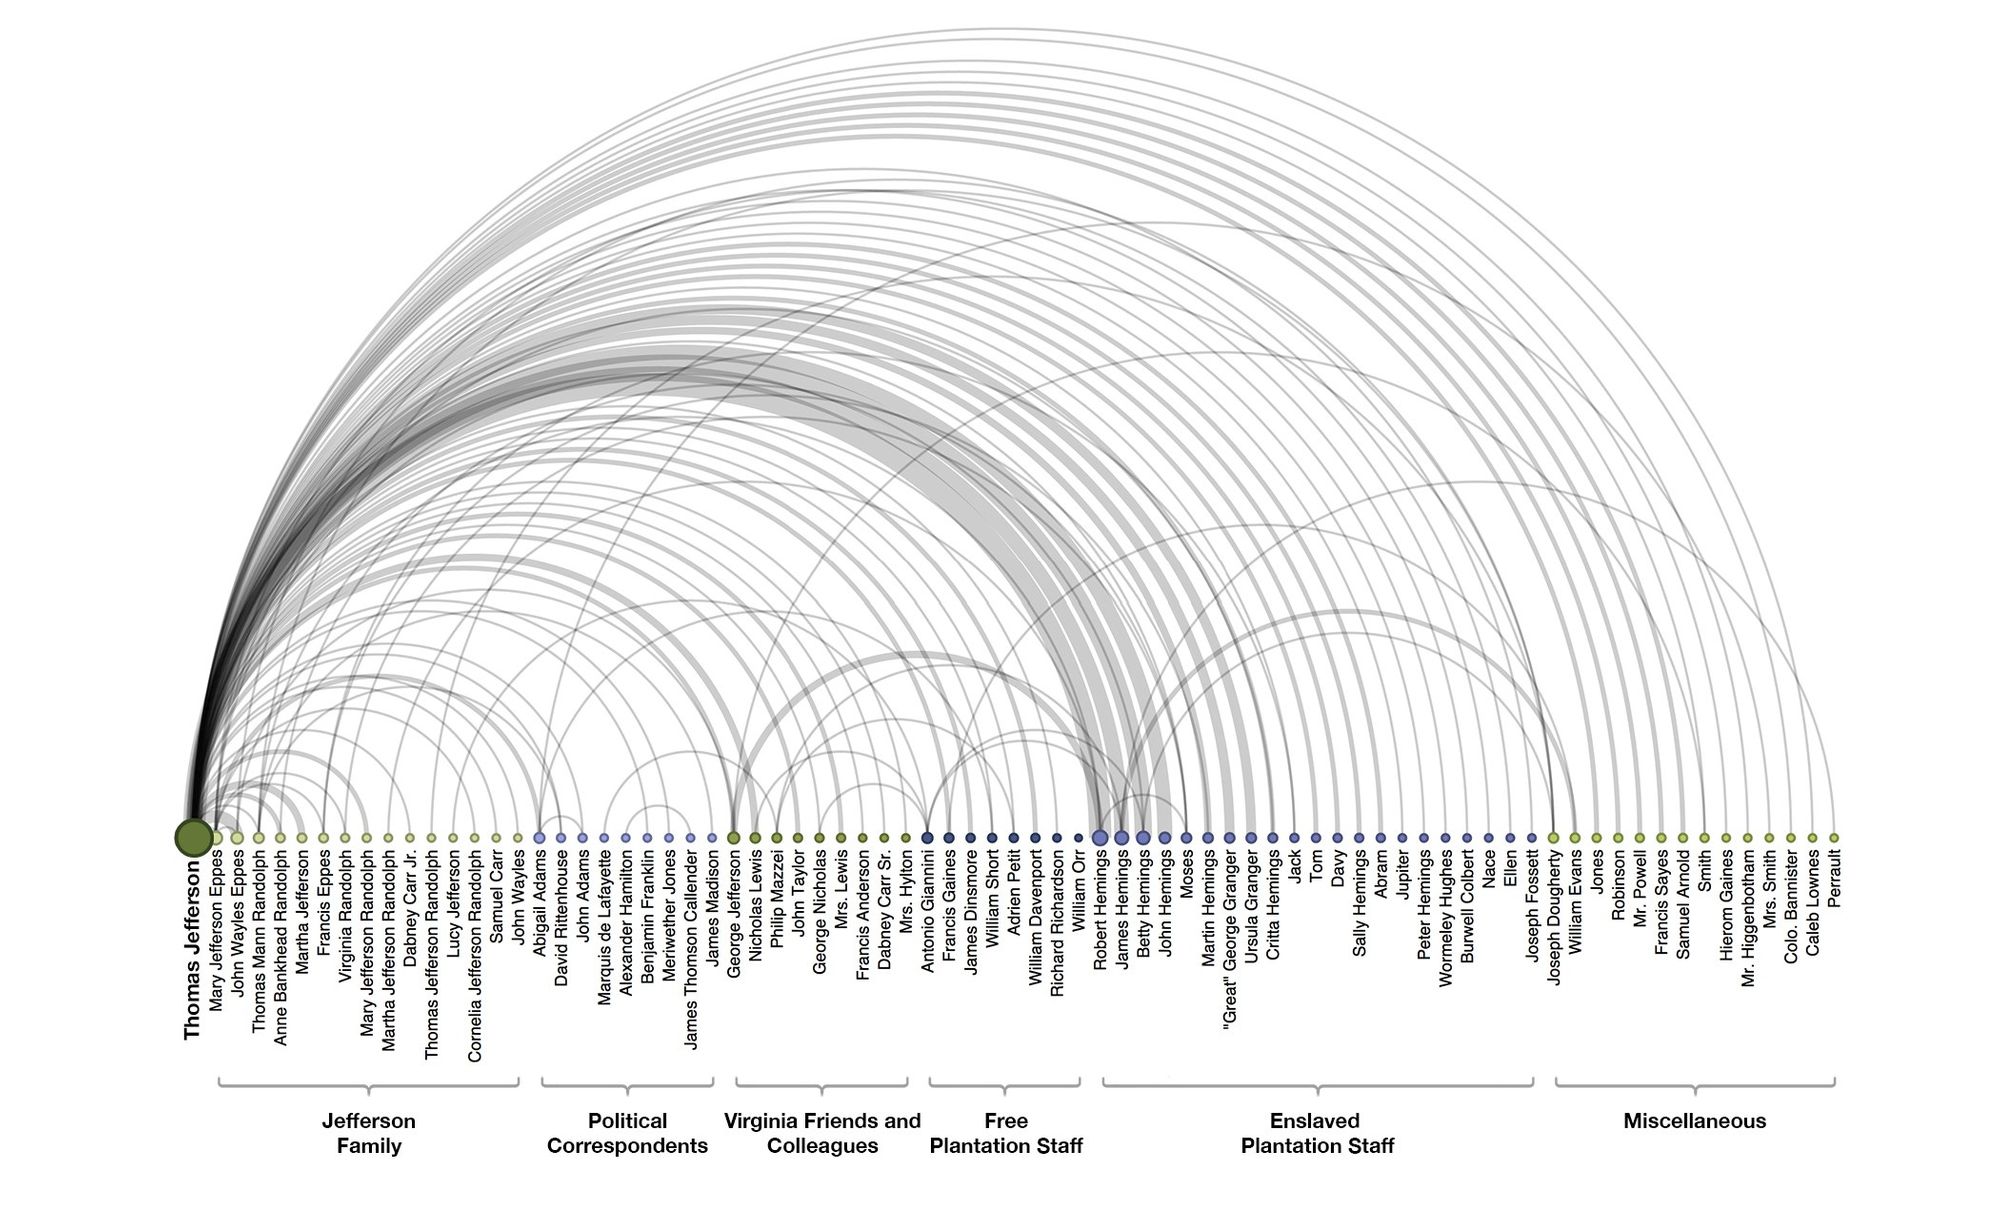
Observations:
a. It clearly conveys interlinks between Thomas Jefferson and other fellow characters.
b. The nodes are characterized into different groups to understand the background of the entity.
c. The width of arc indicates relative frequency of correspondence.
3.2. Character Co-occurrence in the Chapters of Victor Hugo’s classic novel Les Misérables
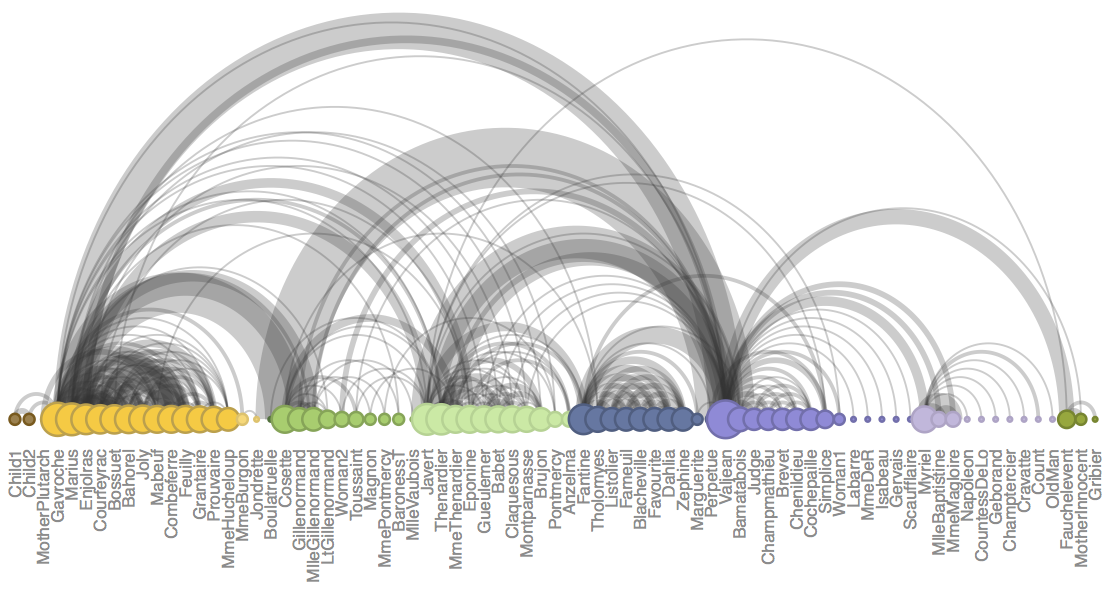
Observations:
a. Each character is connected by an arc if they appear together in the same chapter; the wider the arc, the more the characters appeared in chapters together.
b. The ordering (and colour) of the nodes identify groups of characters that appear in the novel together.
c. The diameter of the node signifies the frequency of appearance of the character.
Bad Examples
3.3. Text Analysis of the Holy Scriptures
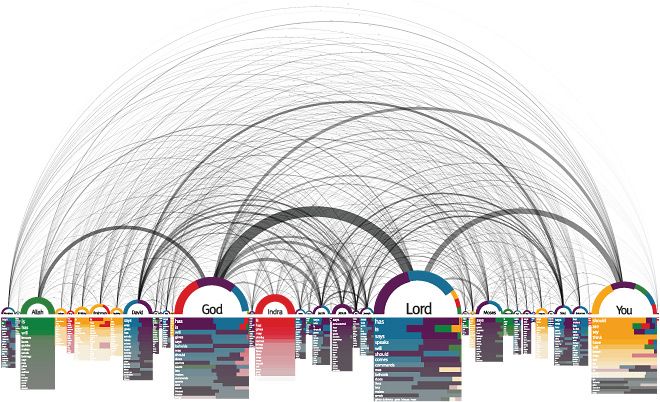
Observations:
a. Diverse methods of visualization including the arc diagram are adapted to translate complex information.
b. The nodes in random order makes the network of the link more complex. Hence, it might be difficult to perceive the network of the connections.
3.4. Bible Cross-References

Observations:
a. The bar graph that runs along the bottom represents all of the chapters in the Bible.
b. The length of each bar denotes the number of verses in the chapter.
c. Each of the 63,779 cross references found in the Bible is depicted by a single arc - the color corresponds to the distance between the two chapters.
d. The diagram gives an in-depth information regarding the cross references; however, the information is too complex to comprehend. Due to overlap in the links a lot of connections seems to be blurred.