- They are used to convey a relationship between two variables, such as change over time of a particular characteristic.
- They are useful for demonstrating things like income increase over time, temperature increase with energy increase, ect..
- Data could be integers, fractions, percentages, ect.. however, the x axis must be ordered.
- The x axis is the independent variable and the y axis is the dependent variable (that changes according to x).
- The x-axis can be categorical, but the y- axis is always numerical data.
- You can have single and multiple lines graphs as well as stacked area graphs.
- Multiple line graphs are used to demonstrate a relationship with several categories.
- Stacked area graphs are also used to convey multiple variables over an interval, but they use whole numbers. The other difference here is that area charts convey volume as well.
How to plot a Line Graph
- Start with a table with your variables side by side in two columns.
- Decide on an interval or scale for your axis.
- Label your axis. Time is along the horizontal x-axis. The other values are along the vertical y-axis. Both axis need to use the same numerical system and measurements being used.
- Add your data as points on the graph corresponding to the x and y coordinates.
- Connect the dots to create the "line" graph.
- Include a key and title for your graph.
Good Examples of Line Graphs
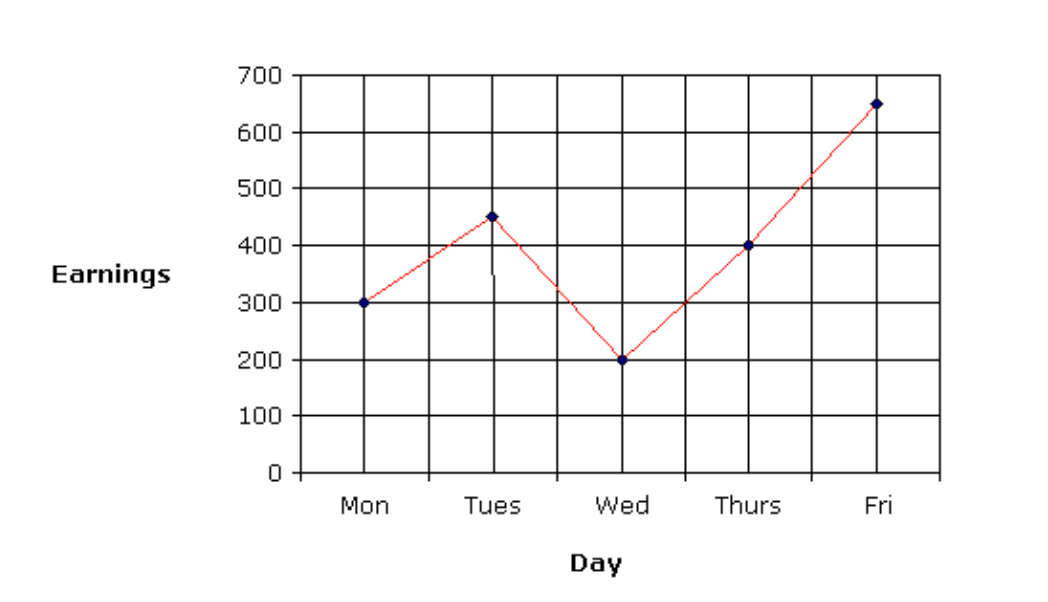
- Less is sometimes more! A simple example of a line graph demonstrating the relationship between two variables clearly. Source: https://www.onlinemathlearning.com/line-graphs.html
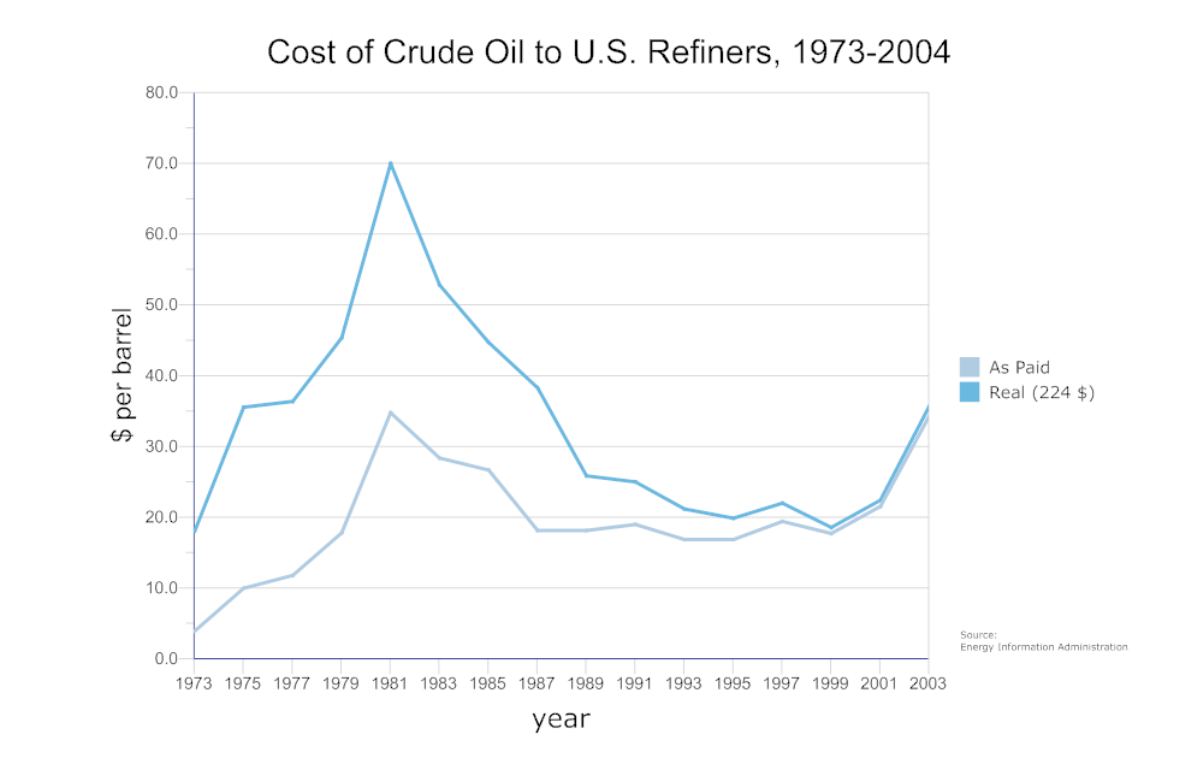
- Multiline graph showing two categories of the relationship between time and cost of crude oil to US refiners. This shows how line graphs, although simple, are powerful in expressing politically and economically important data.

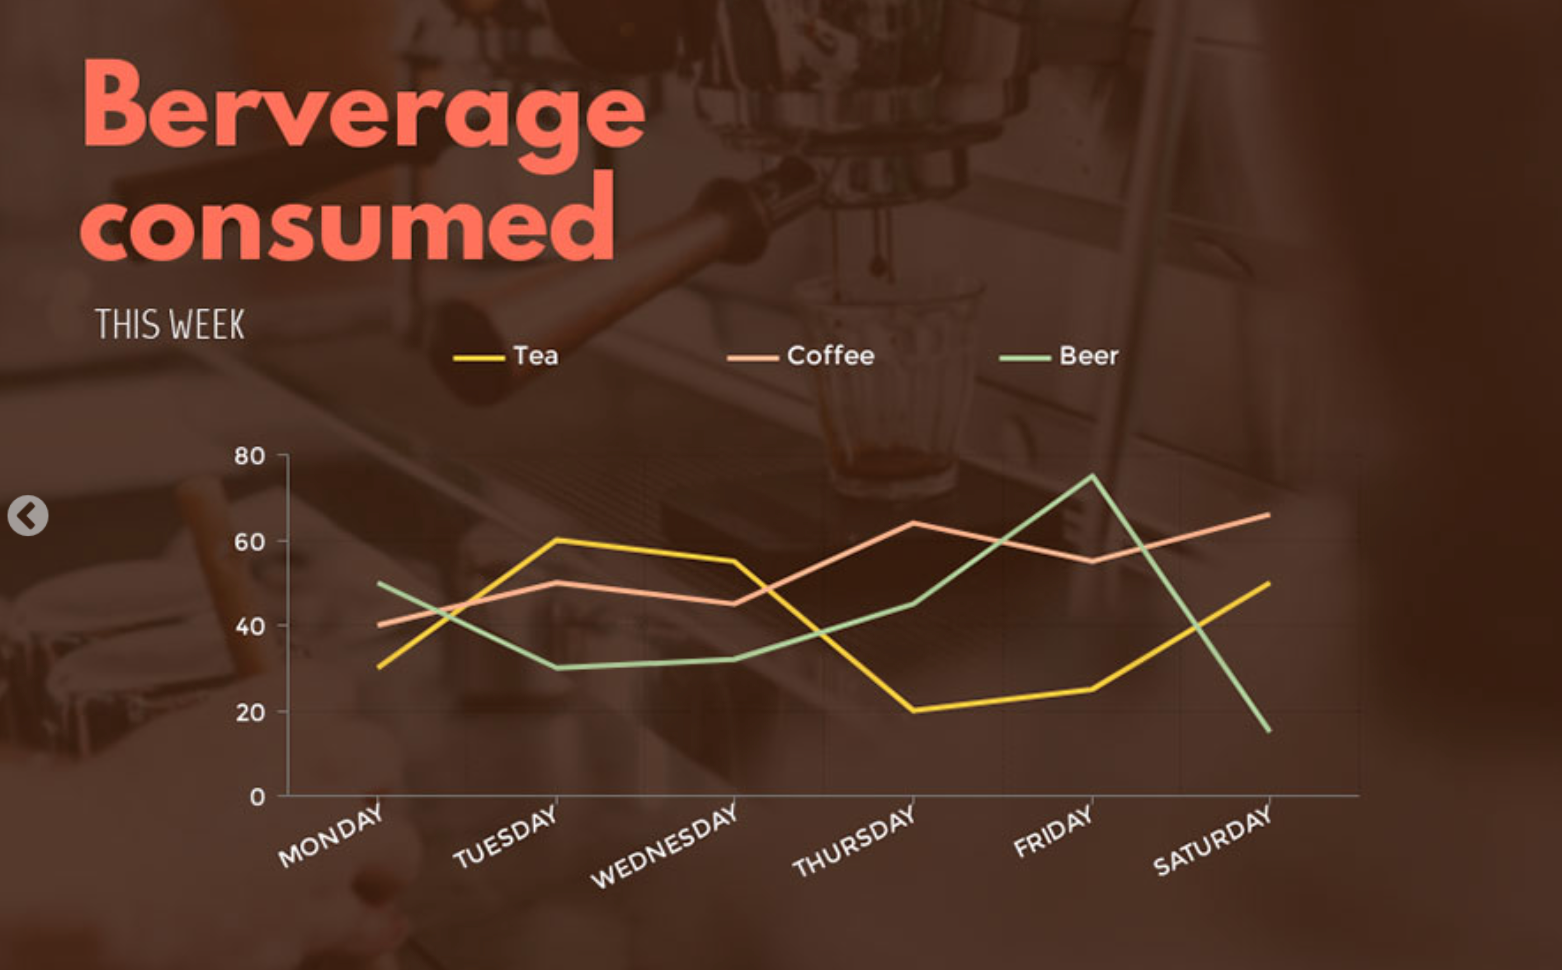
- This is another multiline graph that utilizes design a bit more. Here we see the categories are differiated not just by color, but by texture as well.
Bad Examples of Line Graphs
Although line graphs seem easy and simple to make, we will explore some poorly designed and misleading uses of them.

- This is a bad example of a line graph because it has two y-axis when these should be two completely unrelated variables on seperate graphs.
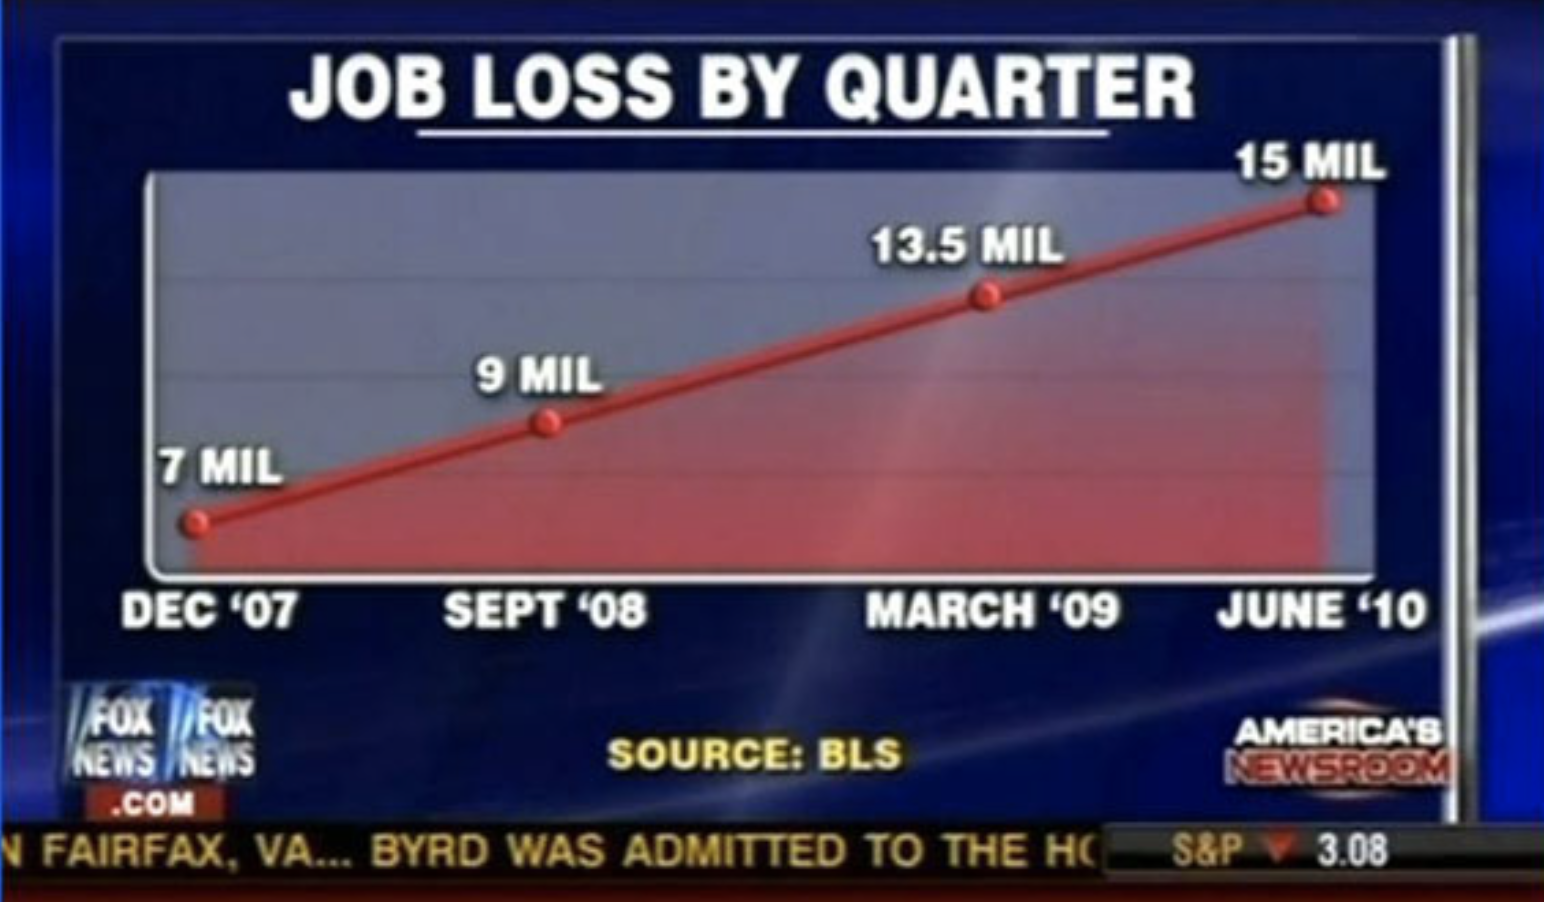
- This graph on the other hand, has no y-axis at all. The intervals are not equidestant. The title purposefully misleads; it shows the number of unemployed not the change in employement at each time interval.
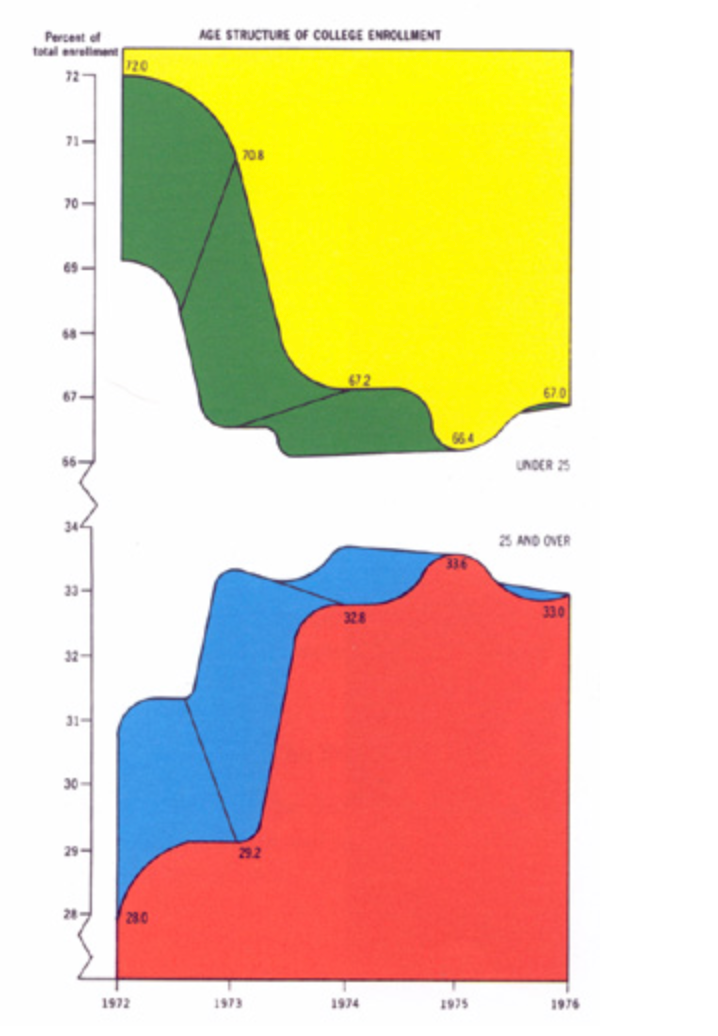
- This is a stacked area chart that is poorly designed by... Edward Tufte! The top section is flipped, the y-axis is broken twice,m the graph is in 3D for no relevent reason, there are only 4 data points being conveying, and the colors are not aesthetically pleasing. The graph is unnecessarily hard to read.