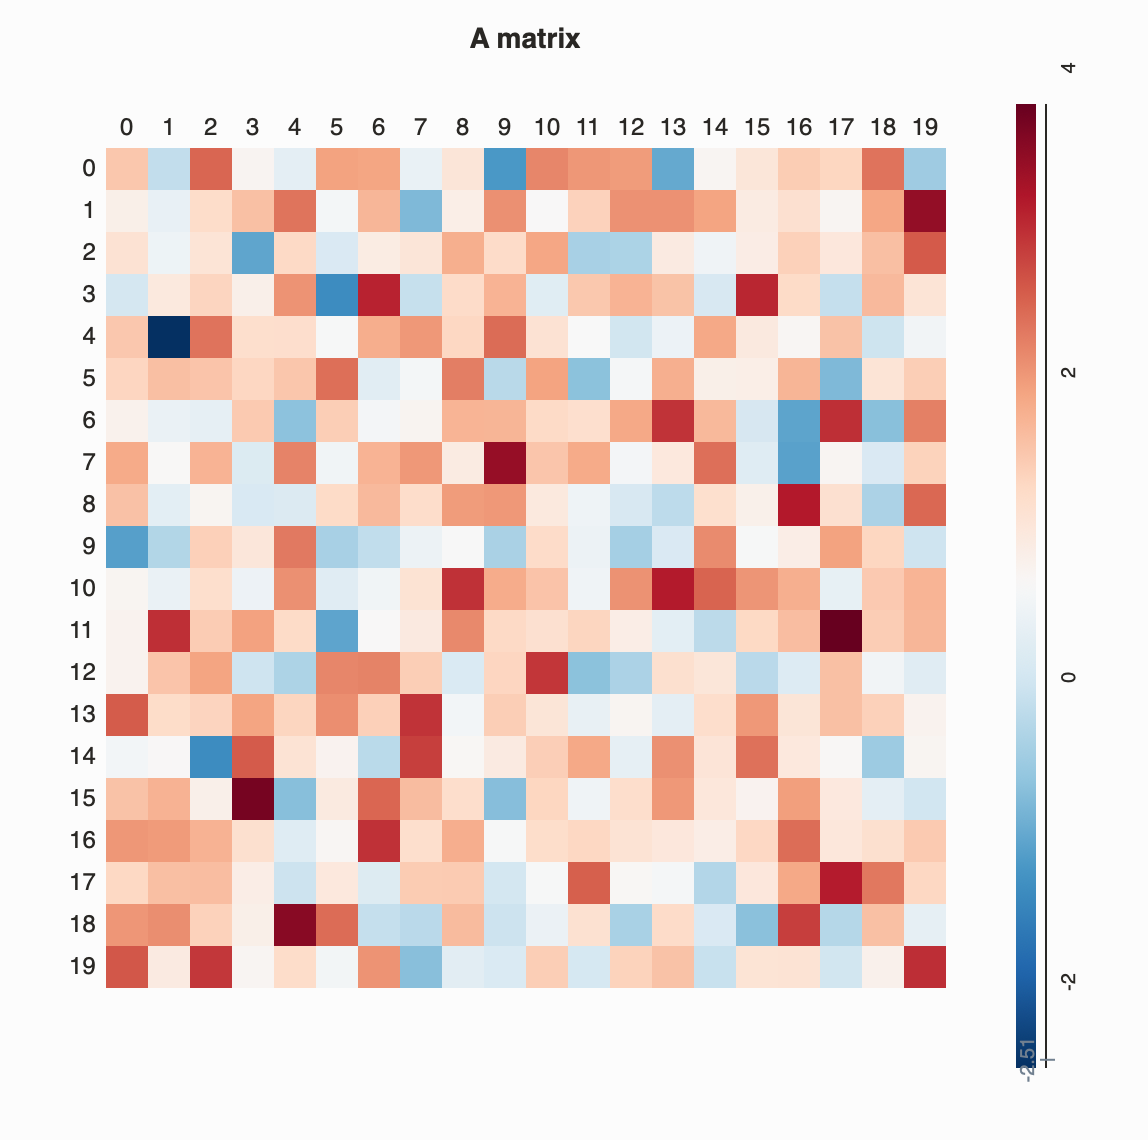
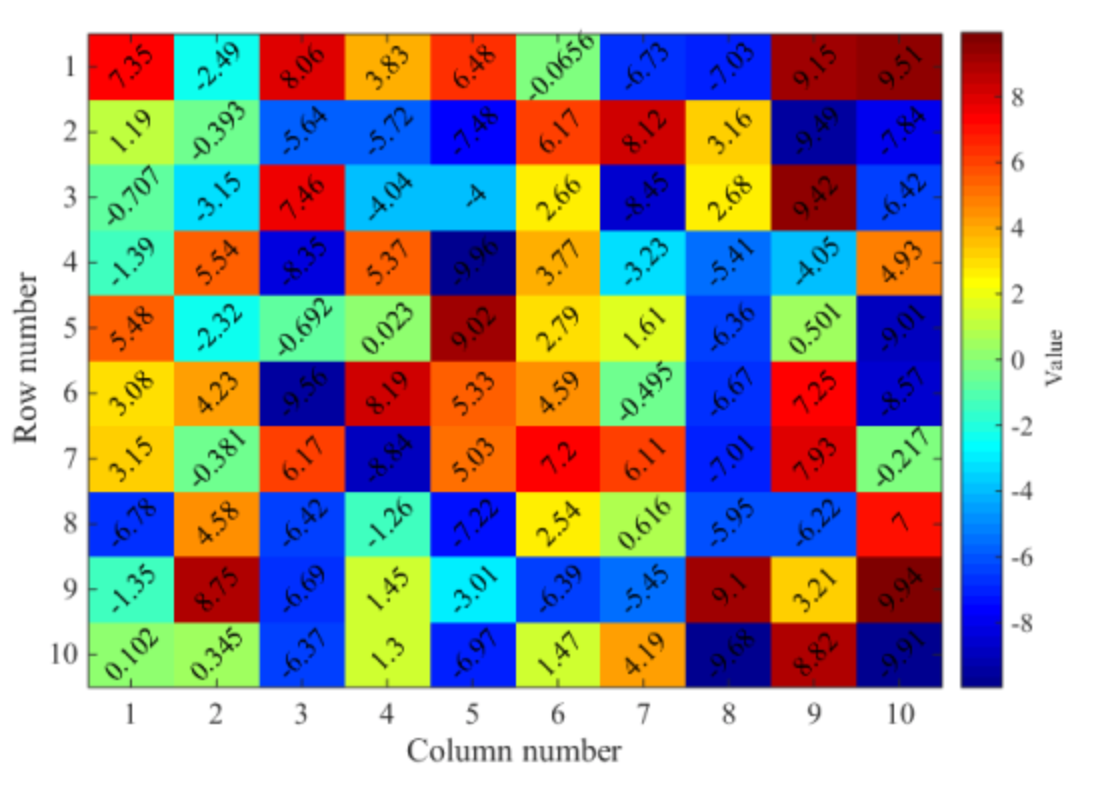
Is a graphical technique that can simultaneously explore the associations between thousands of subjects, variables, and their interactions, without needing to first reduce the dimensions of the data. Matrix visualization involves permuting the rows and columns of the raw data matrix using suitable seriation (reordering) algorithms, together with the corresponding proximity matrices.The permuted raw data matrix and two proximity matrices are then displayed as matrix maps via suitable color spectra, and the subject clusters, variable groups, and interactions embedded in the dataset can be extracted visually.

