Values Represented:
Multivariate, numerical data. These visualization tools allow comparison between many variables together to be able to see the relationships between them and bring visibility to outliers. For example, you may want to compare the specs of a specific product from multiple brands.
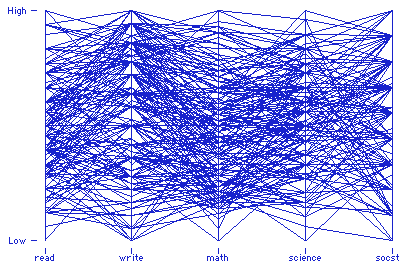
The plots can easily become cluttered and difficult to read. Bw strategic on the axes (or rays in a star plot) you choose to include and offer a way to isolate information if possible. For star plots, separating the lines by at least 30 degrees from each other is best, and avoid layering them on one radar chart.
Pre-Processing:
Consider the specific axes to include, and what axes order makes sense for the reader to best understand the data, or to best communicate specific patterns. For parallel coordinates, the axes can hold different types of values. Star plots variables are typically normalized.
Mapping:
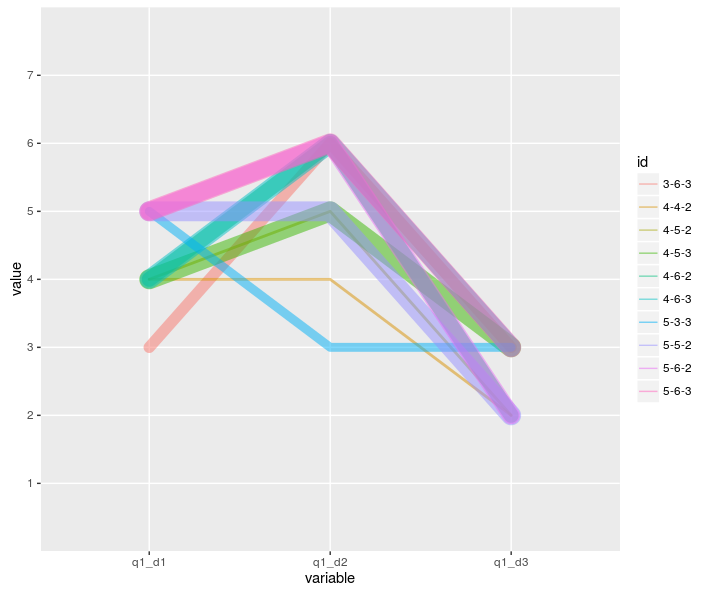
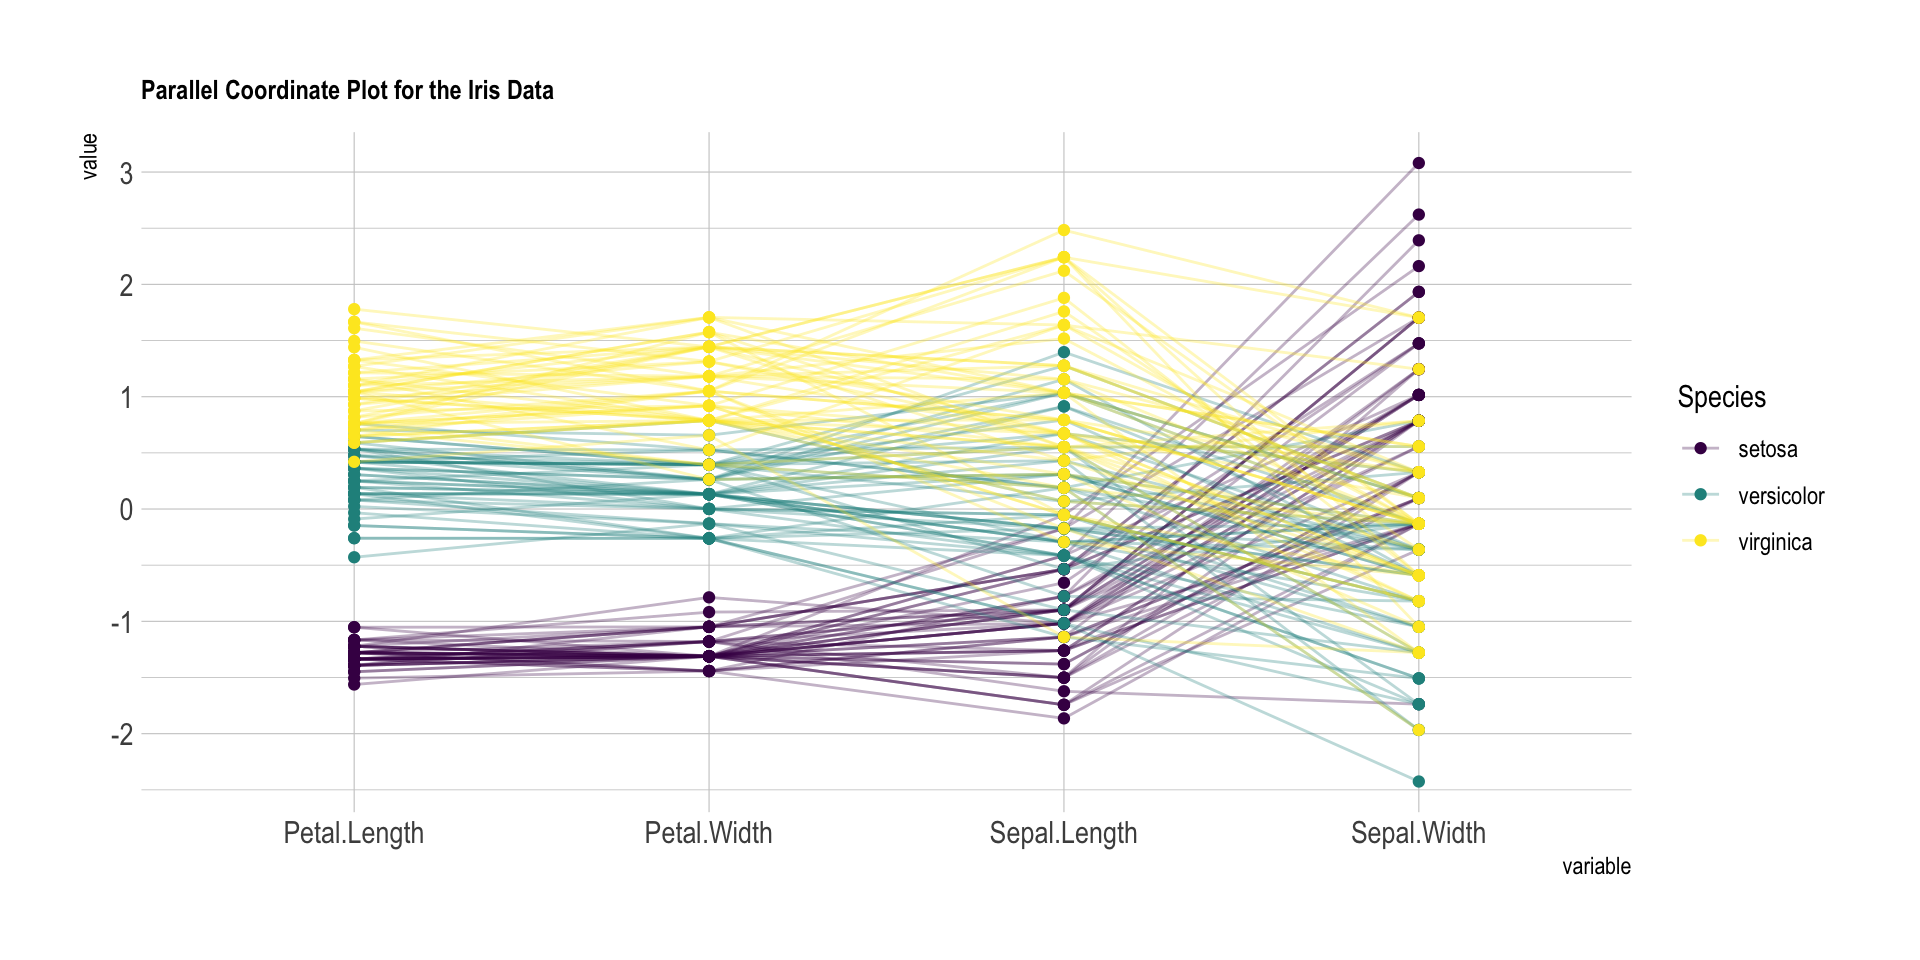
Parallel Coordinates: Each variable has its own axis and axes are parallel to each other. The values are plotted as a series of lines that connect across all the axes. Each line is a collection of points. The axes can have different values from each other.
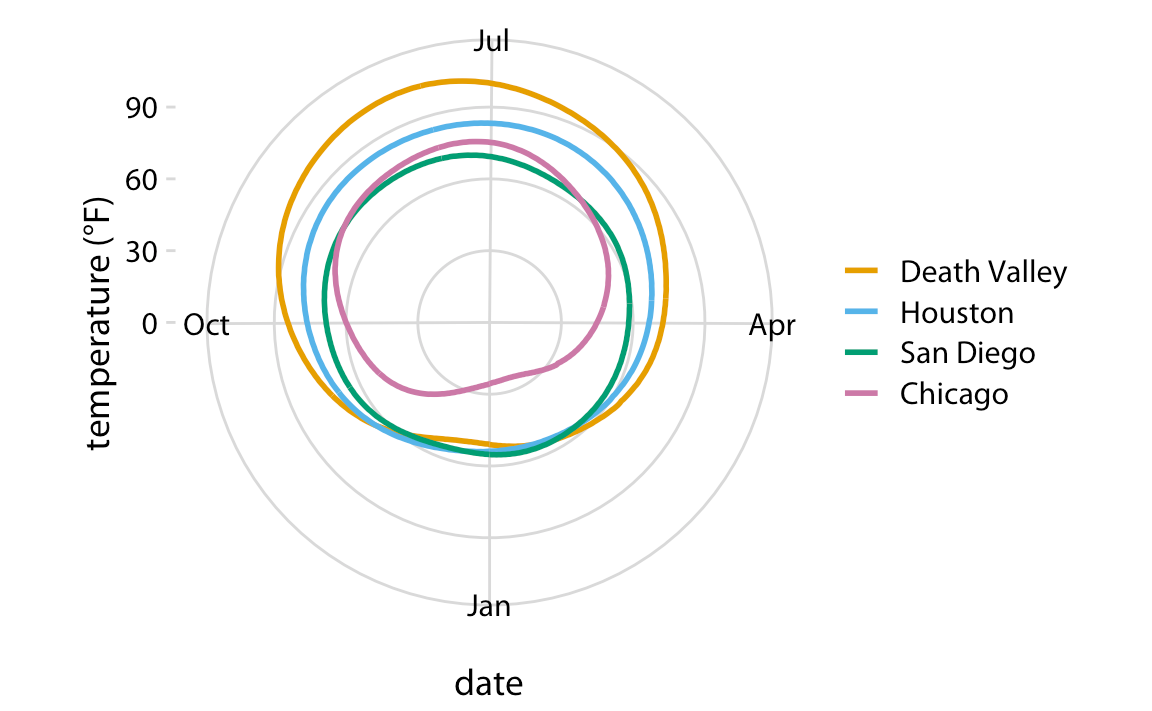
Radial Coordinates: one axis runs in a circle, while the other extends radially out from the center. The values are plotted along the these axes.
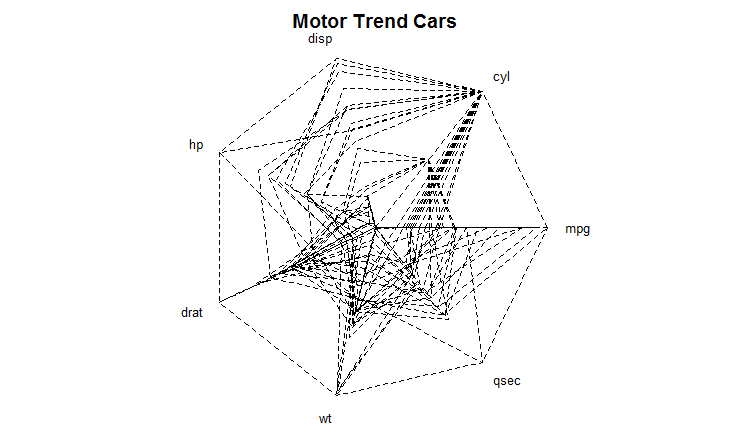
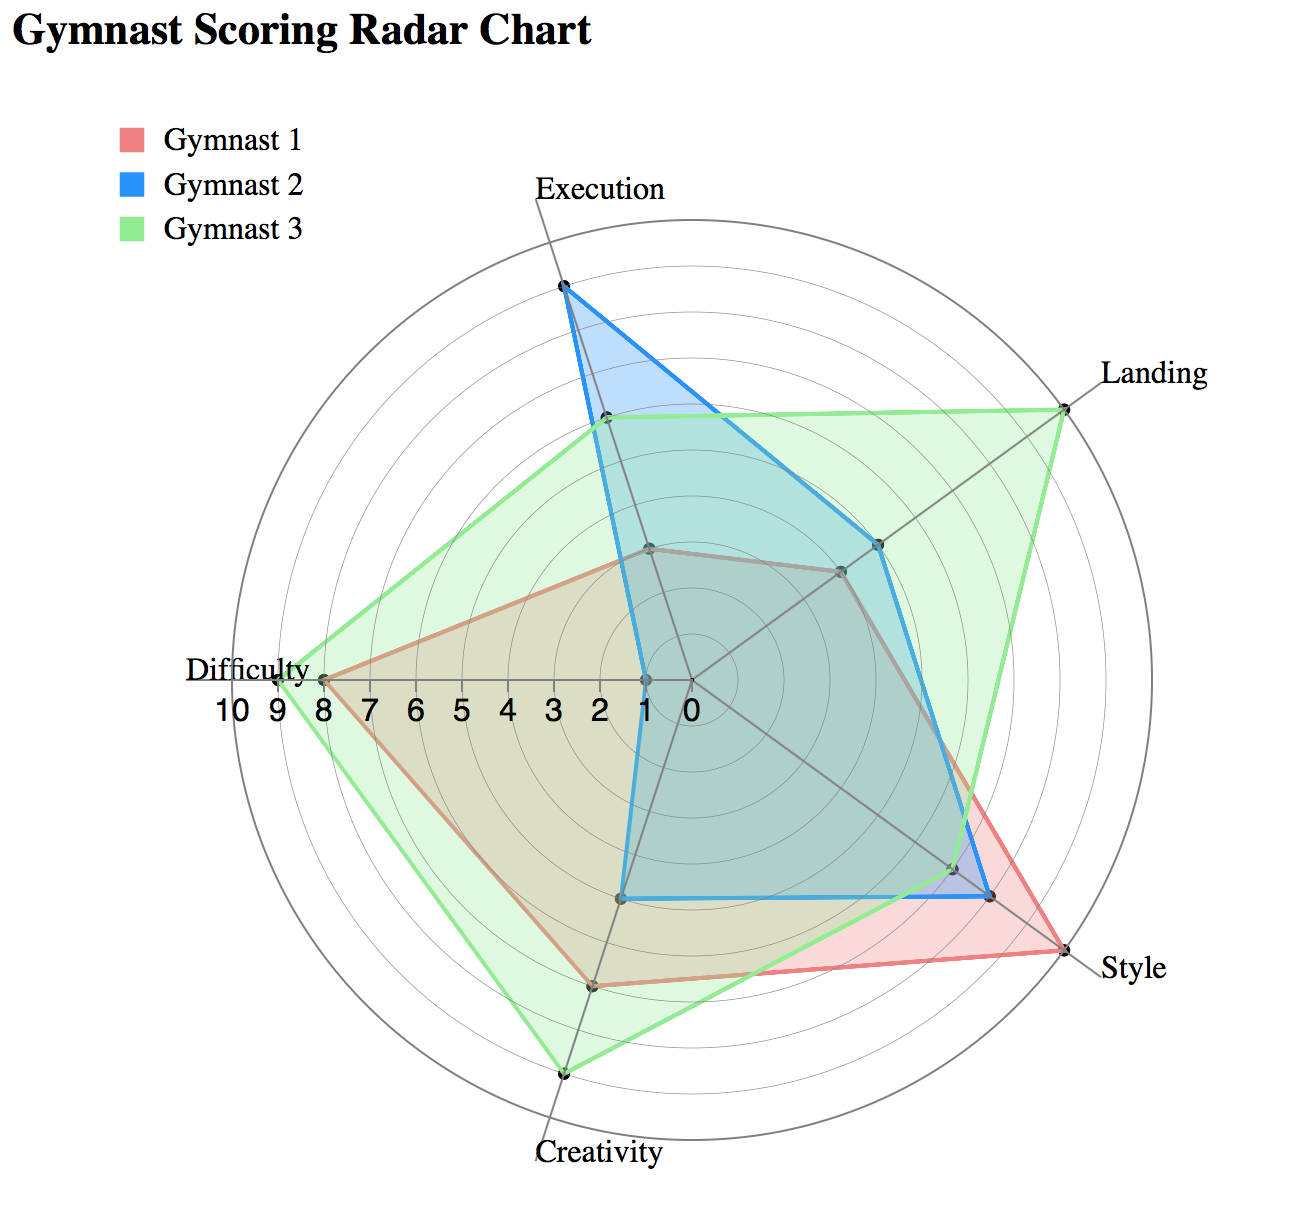
Star Plots: Each data record is shown as a star-shape, allowing one ray for each variable. The ray is proportional to the value of the variable. The ends of the rays are connected with lines.
Good Examples:
Poor Examples: