Sankey diagrams are a specific type of flow diagram, in which the width of the arrows is shown proportionally to the flow quantity.
History
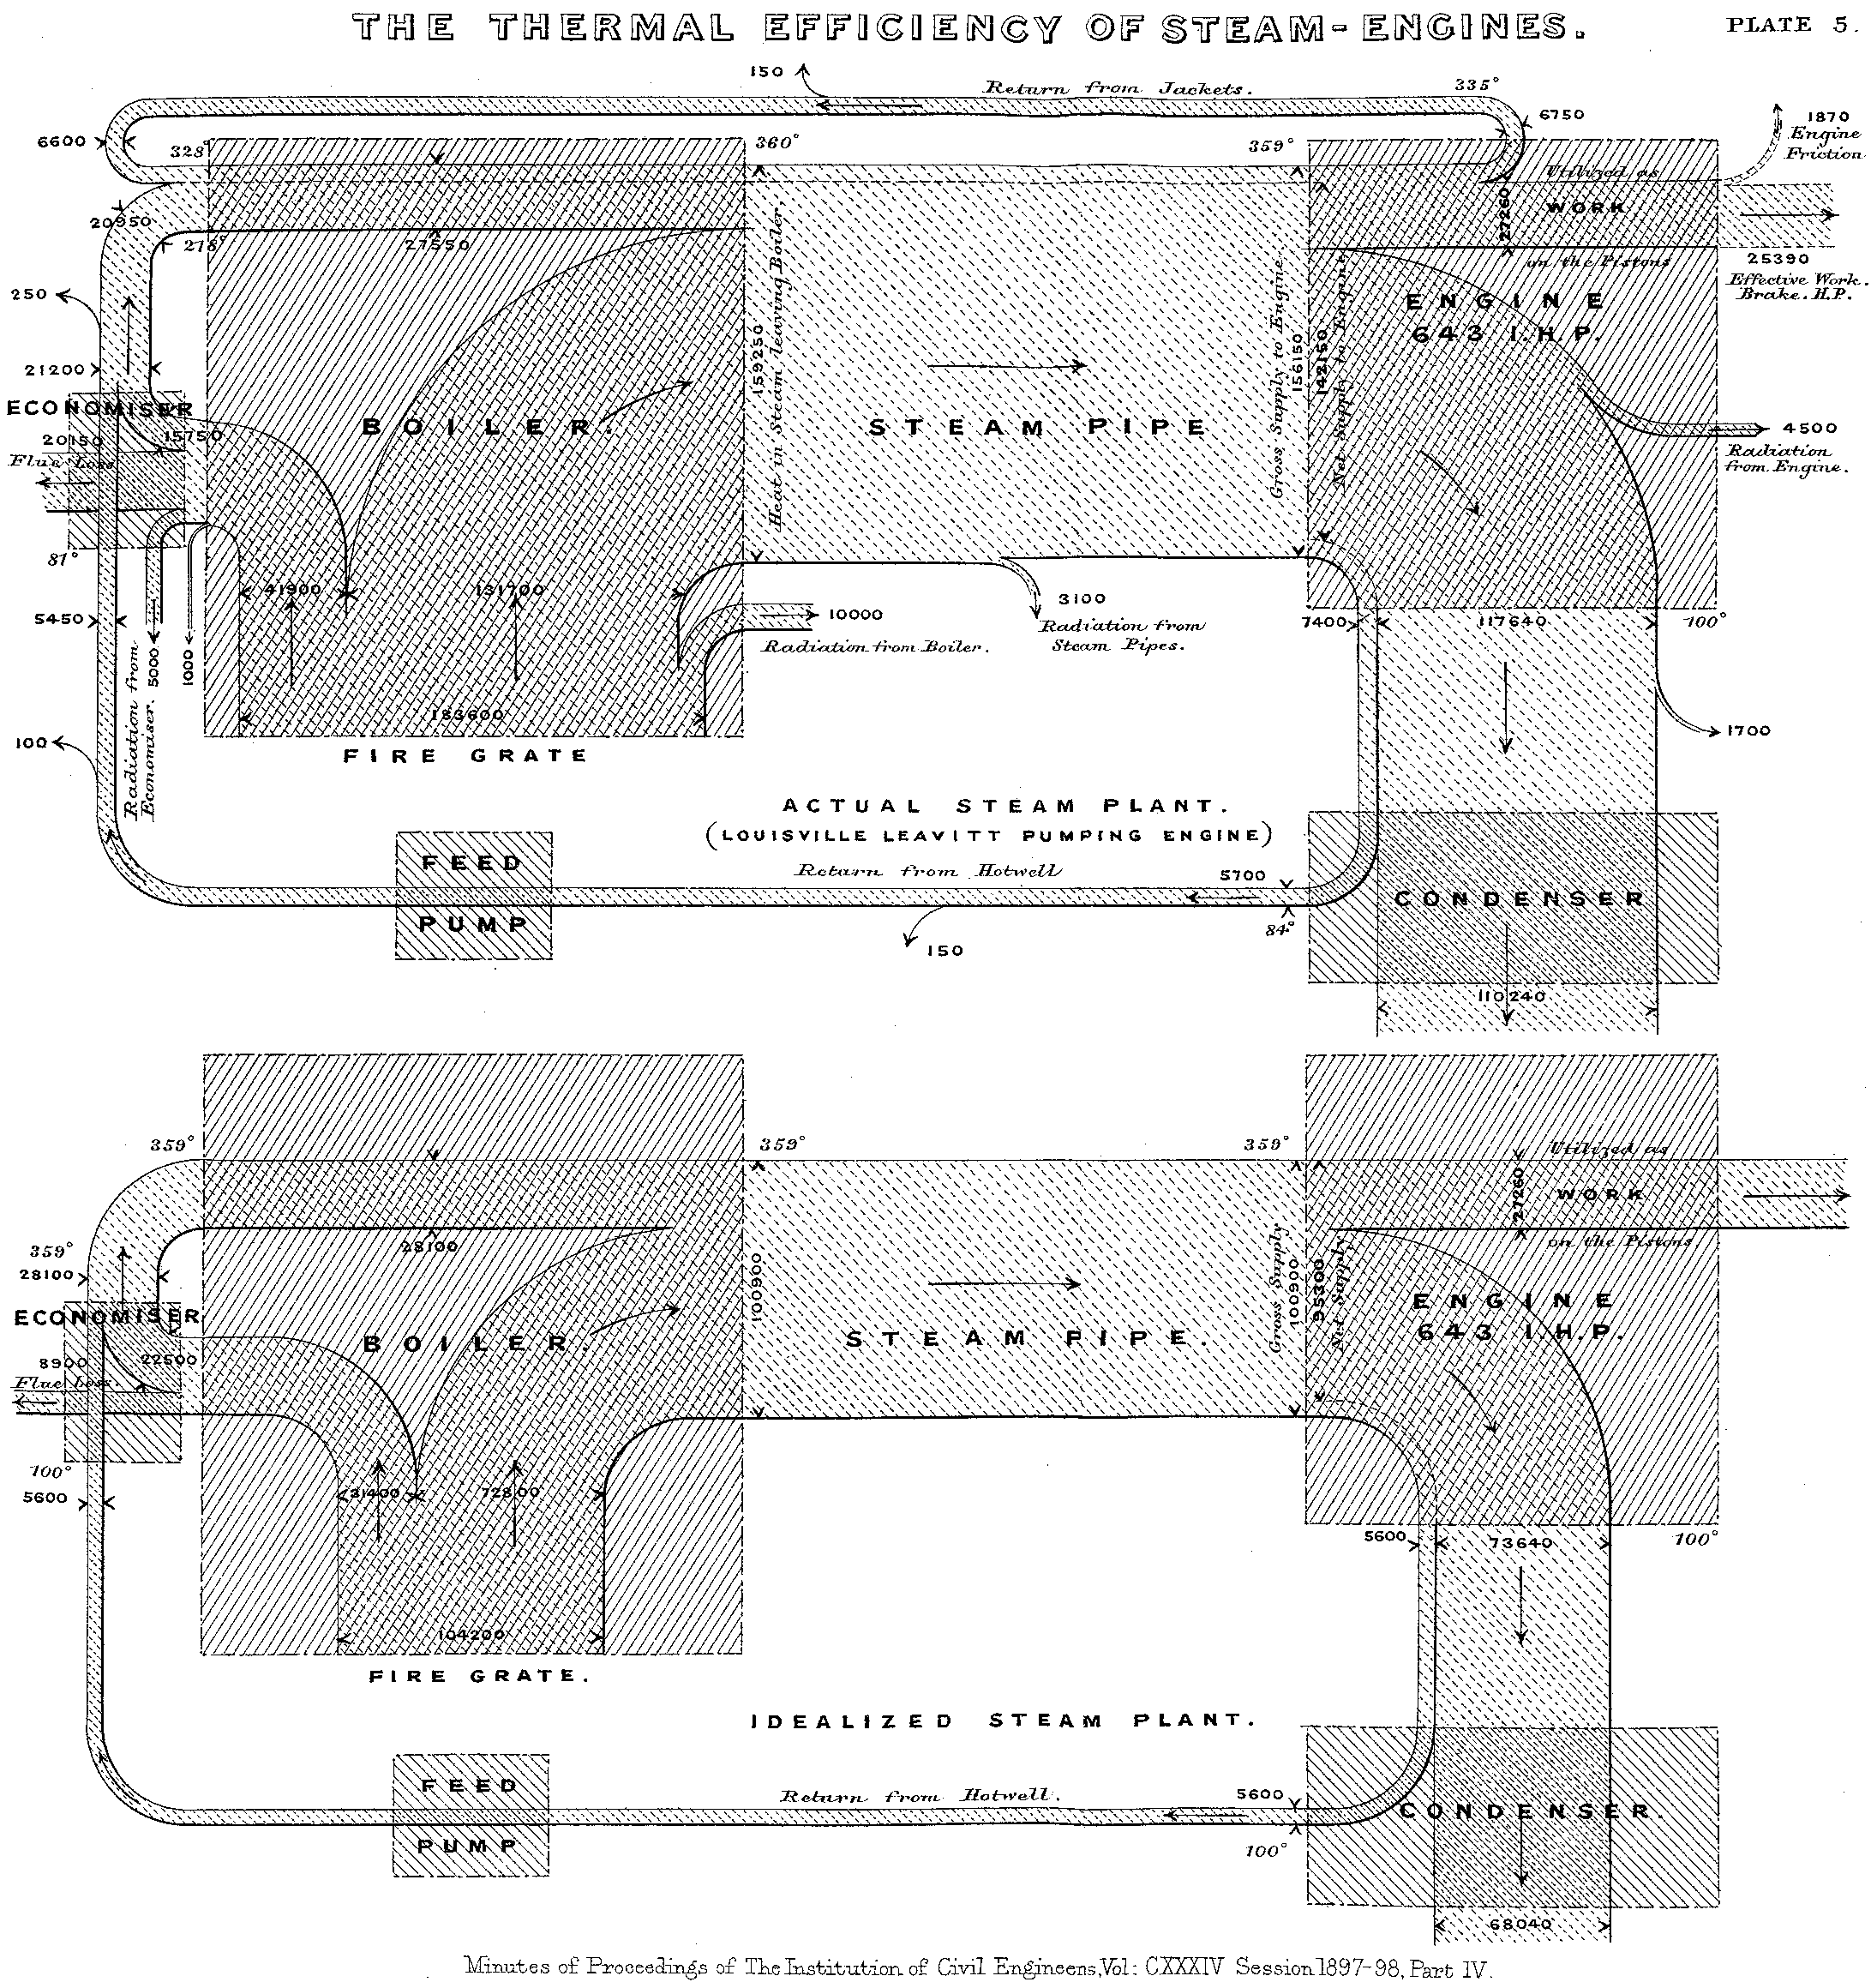
Created in 1898 by Captain Matthew Henry Phineas Riall Sankey, who used this type of diagram to demonstrate the energy efficiency of a steam engine.
Popular Uses
Sankey diagrams are often used in fields of science, especially physics. They are used to represent energy inputs, useful output, and wasted output. Examples can be found across major worldwide energy organizations using the US Department of Energy and the International Energy Agency.
Pre Processing Requirements & mapping data
All of the data is categorized, starting with (usually one) category that encompasses all others. This category is then broken down into subcategories, and then into additional subcategories, for as many times as is needed to end up with individual items.
Therefore in order to create the chart, both the csategories and associated subcategories need to be know. The sum of the totals of all of the individual items must match the total of the associated category.
The main category will usually take up around 3/4 of the diagram height as a block of color on the left hand side. The diagram is read from left to right and at each breakdown into a sub cageory the block is split into additional colors with the size of the block being in relation to the % of the previous overarching category. Once the main cateory has split, there is space left between the subcategories to help differentiate them. This process is repeated for the additional subcategories.
Three bad Examples
The main intended use of Sankey diagrams is to coney flow, be it the flow of energy, money or anything else.
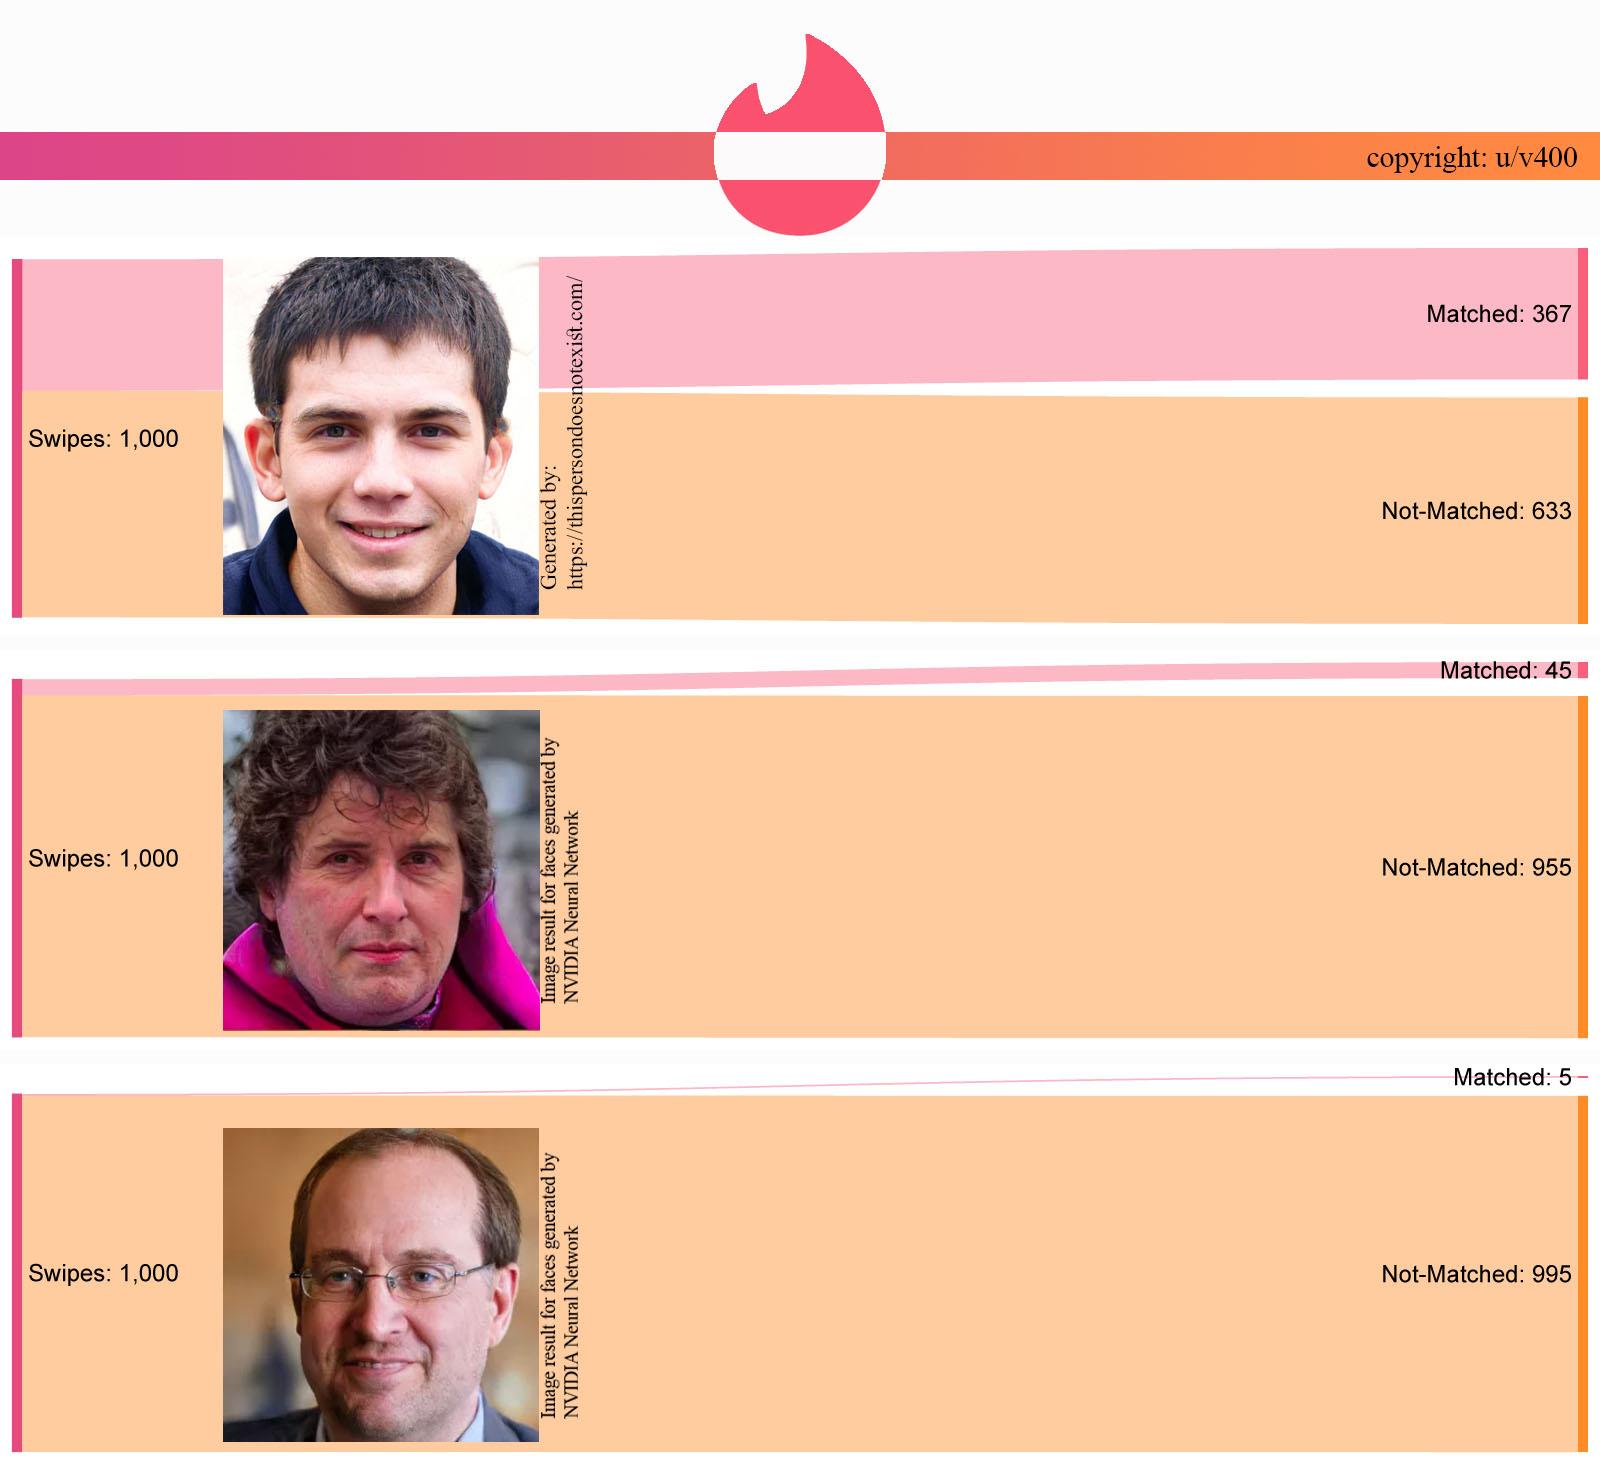
While this example does not convey the flow of anything, it does correctly break down a starting total of 'swipes', however this is only broken into two categories. While there is no rule to say that Sankeys diagrams cannot be used with two categories, this information could have been displayed in a clearer manner through a bar chart.
In addition to this, Sankeys diagrams are rarely used in comparison with each other.
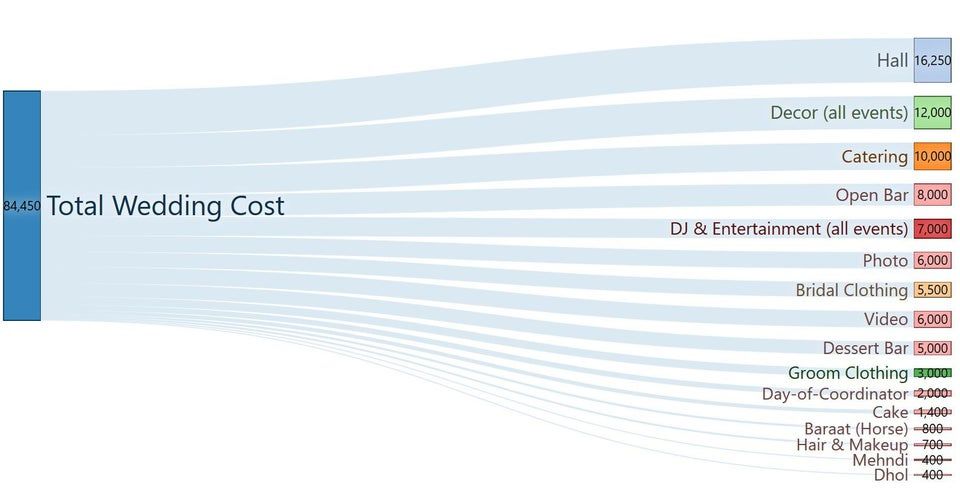
This example could be considered to be showing the flow of money from the total wedding fund, but there are no subcategories between the total and the individual topics making no real use of the unique properties of a Sankey diagram. This could have easily and clearly been represented in multiple other options including a bar chart, or a simple pie chart.
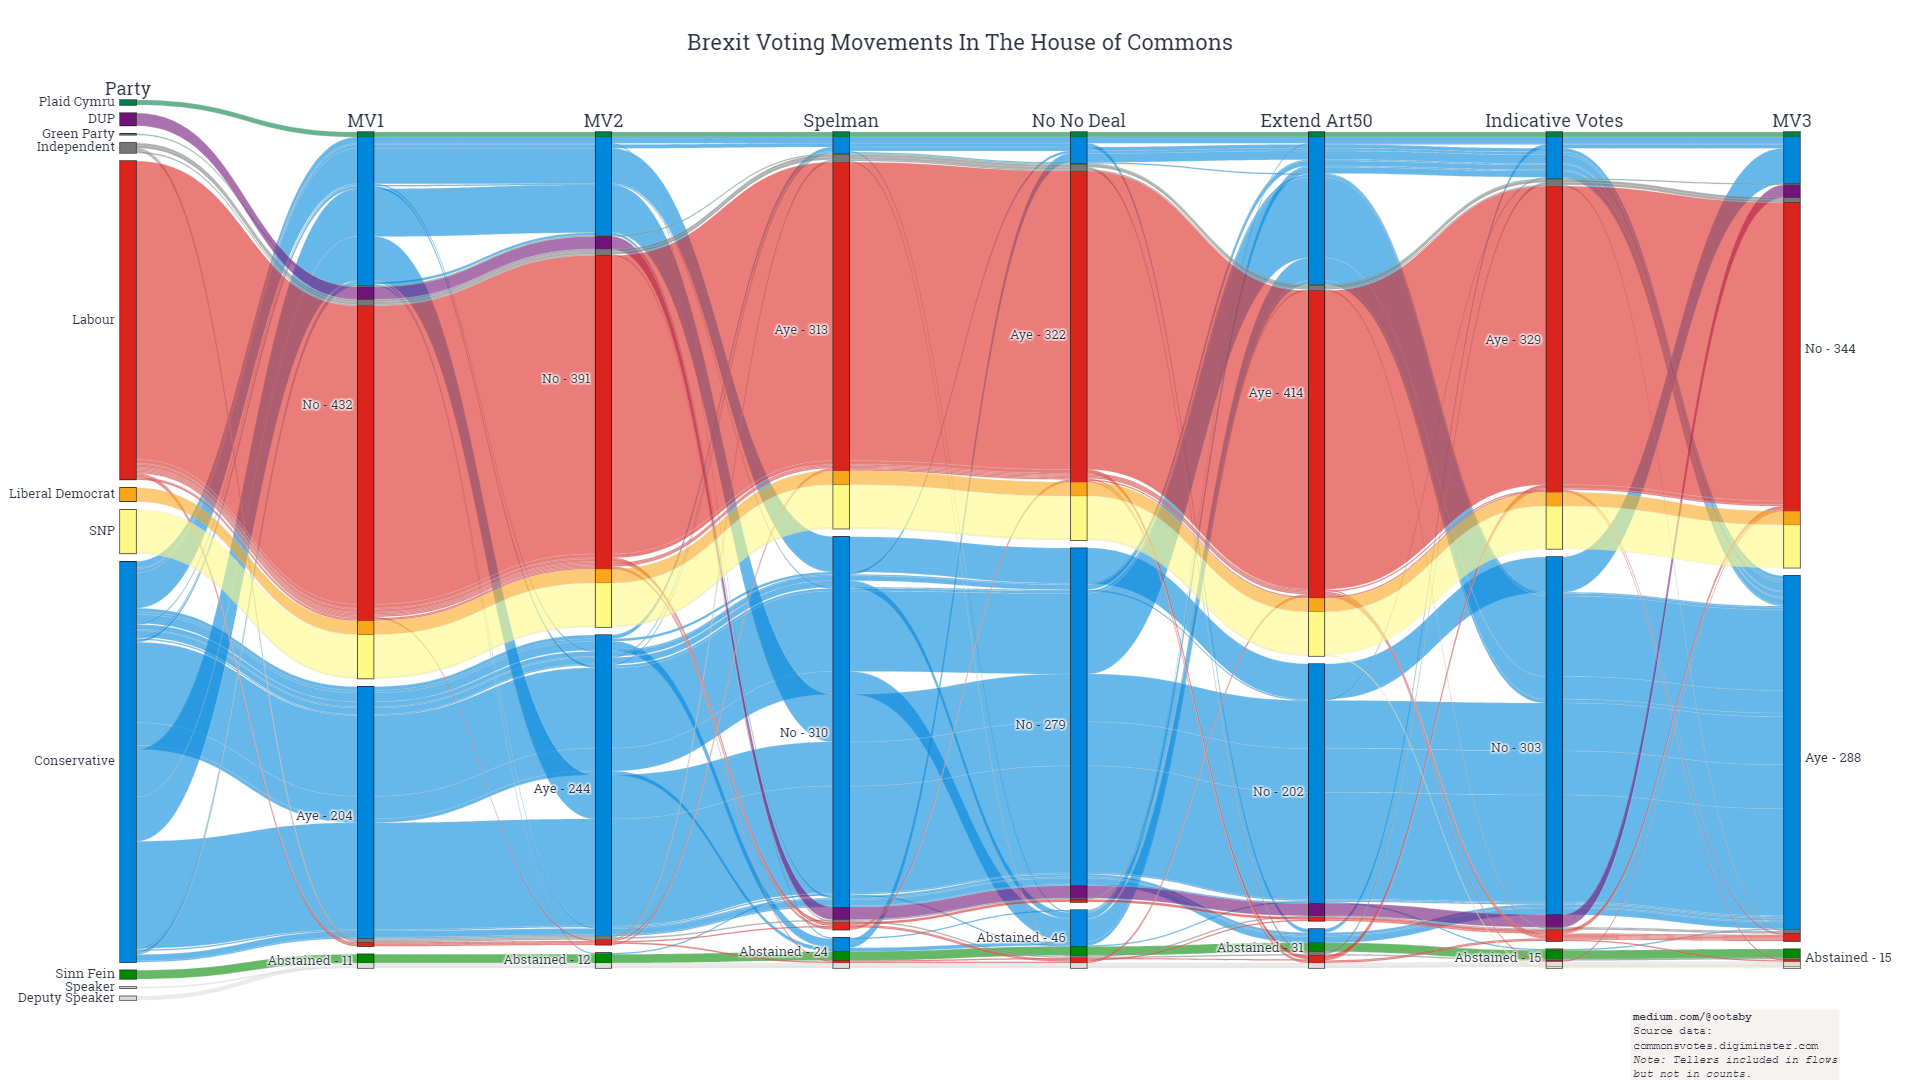
This example looks impressive and be based on an interesting dataset, but the flow of information cannot be followed easily and the flow of each line unnecessarily jumps up and down the vertical axis. Similar to the example above, this also does not have any sub categories between the start and end points and does not convey and form of flow.
Three Good Examples

This example from the Swiss Info Platform does lack mutliple categories, but clearly demonstrates the complex topic of the flow of asylum seekers from their home county to Europe. The interactive diagram both highlights the individual flow path and adds the number of asylym seekers as a total number and percentage of people originating from that country.
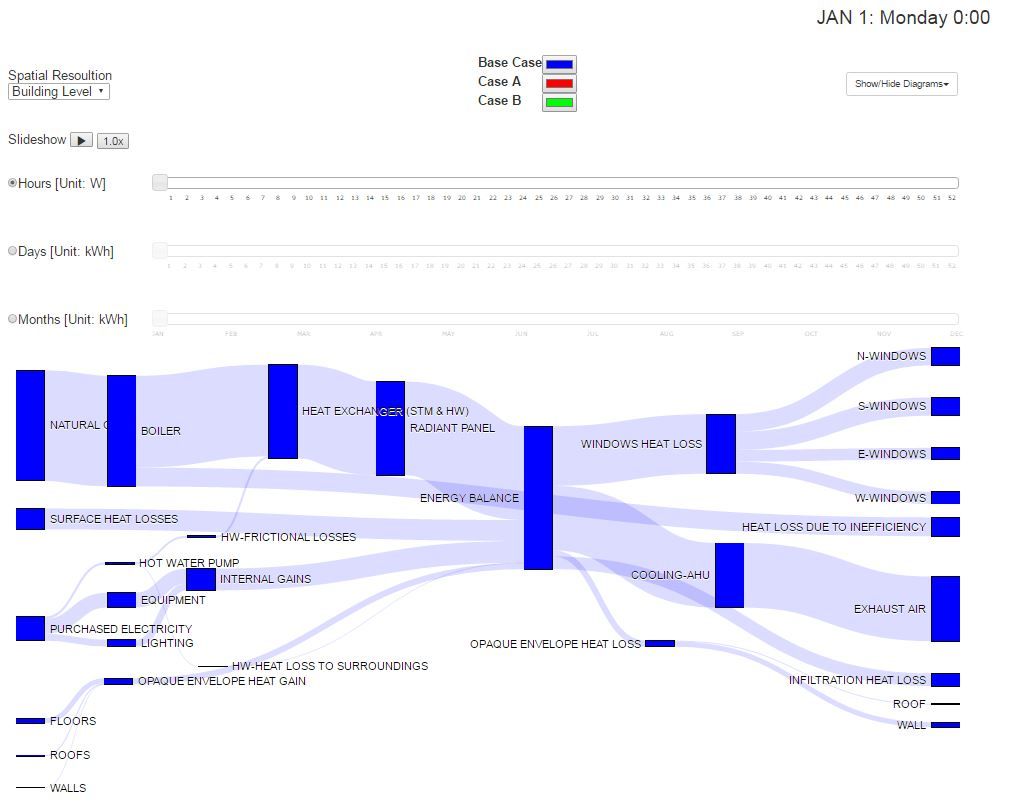
This example from Carleton University does lack specific values on the diagram, however they are not a necessity for the intended outcome. The diagram clearly shows the flow and loss of heat within a building and the diagram adapts based on the users selection of 'energy efficient' aspects.
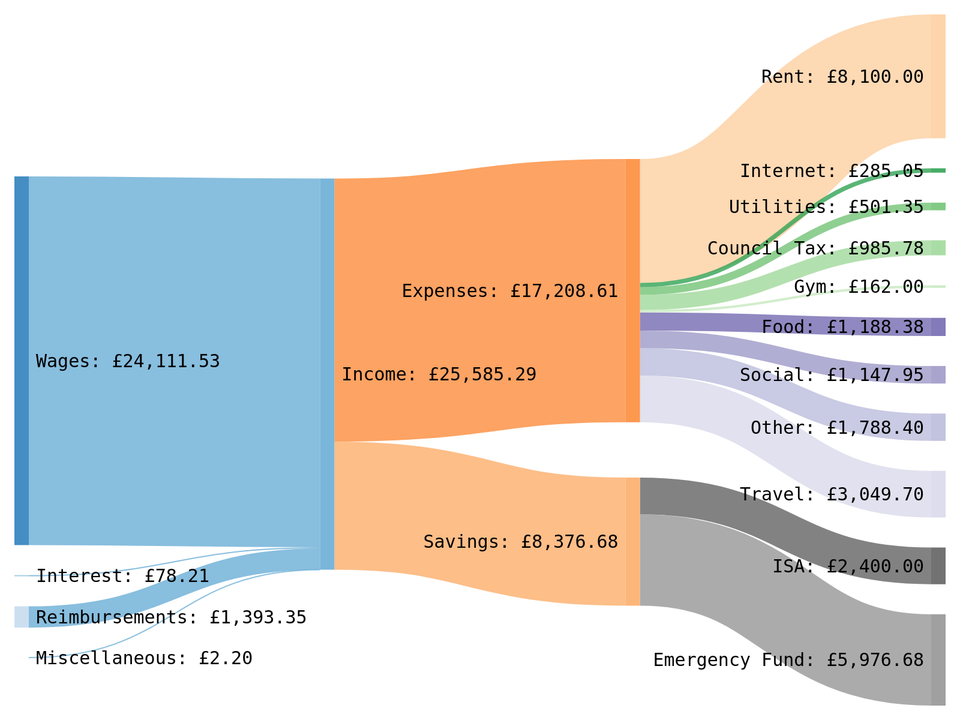
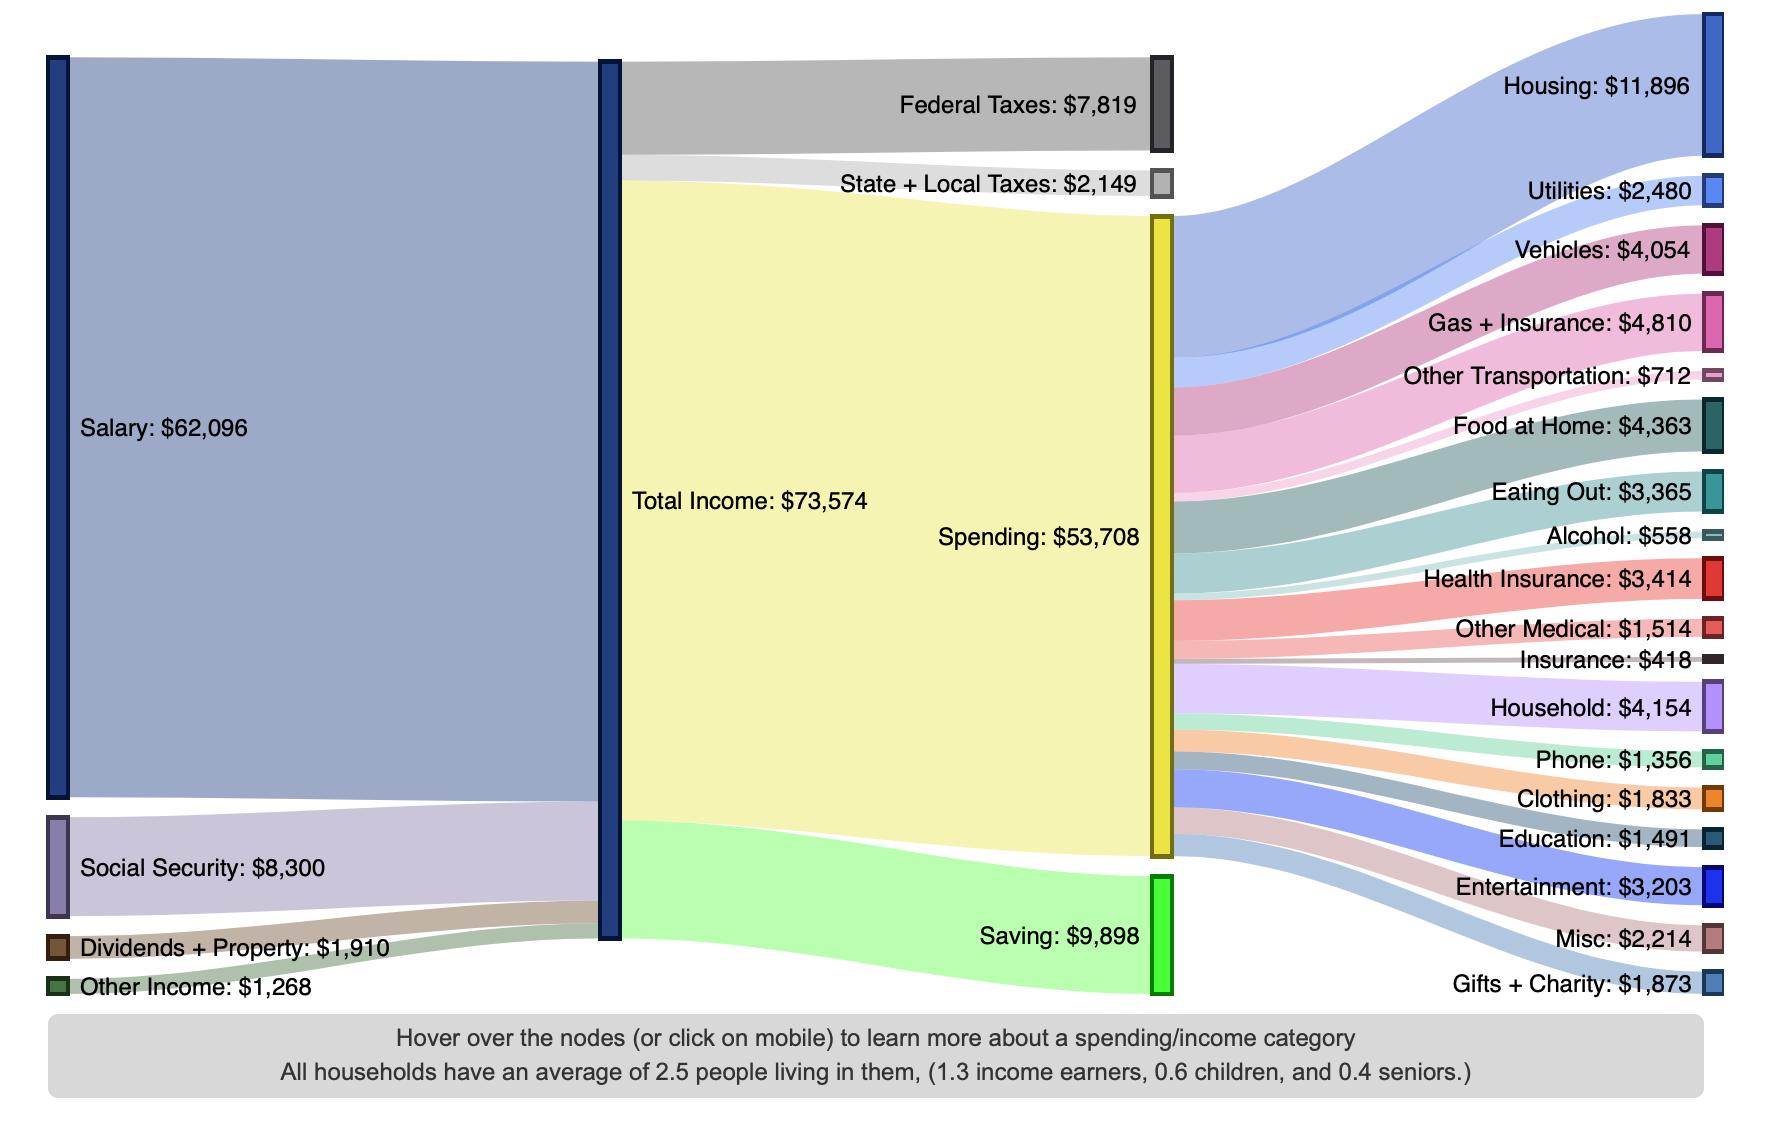
A simple yet clear example of a growing use of Sankey diagrams, which is to display the flow of money. This example demonstrates that multiple sources can come togther before being split into sub categories. The addition of clear labels and values makes the diagram easy to follow.