Though the tree and the graph are related, they are not equivalent. Let's get a sense of some history and background.
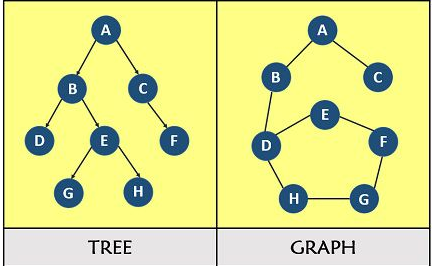
Both the tree and the graph are non-linear data structures, the main difference as seen below in Fig. 1 is that a tree (on the left*) follows hierarchically ordered data connected by lines or branches with one root node, and the graph (on the right*) is a structure representing a network with less order, which can also connect back on itself.
Let's dig into each of them.
History of The Tree
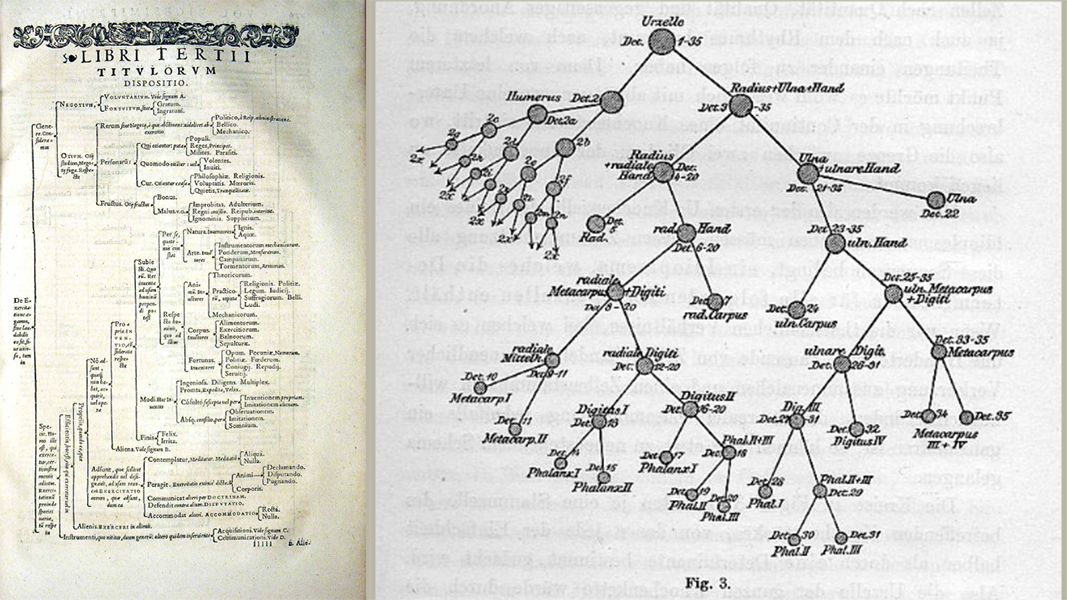
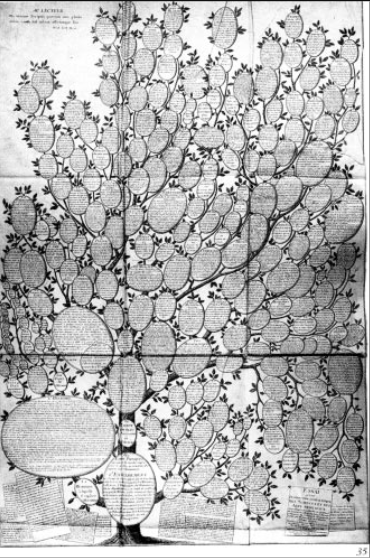
Throughout history tree structures have been used to represent an order of hierarchy, from bloodlines to mapping the world's knowledge. Many attempts by early scientists and philosophers to map a hierarchy of human knowledge can be seen below as knowledge trees from the 16th and 18th centuries.
The Anatomy of a Tree
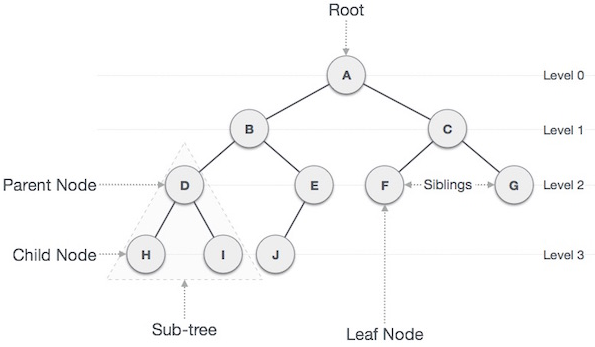
The tree structures have a main root node with branches stemming from the base. Illustrated below you can see the relationship of the root node to the parent and child nodes as we progress downward each level of the hierarchy. A few clear examples follow.
1).
Use in Search
When structuring data, tree representations can be used in many ways. Below you will see a sample of an Optimal Binary Search method using a tree structure.
2).
Tracing a Hierarchy
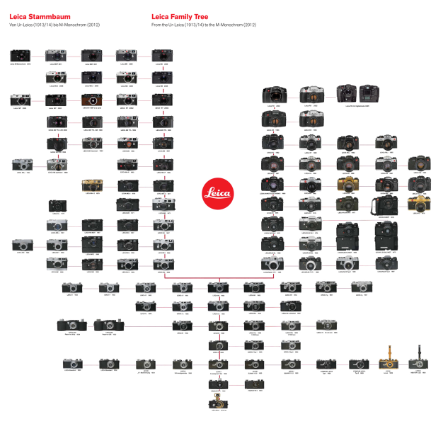
Here's an interested use of a tree structure used in advertising to display the evolution of Leica camera models from 1914 to 2011. The "family tree" of cameras was sold as a lot at a Christie's auction.
3).
Difficult to Decipher Examples
In many cases, trees are used conceptually but don't quite capture the relationship or hierarchy of data--so many times they don't capture the associations when looking at them. In several cases it's a matter of labeling and ordering the relationships for the reader to understand. Here are a few poor examples / or difficult to decipher tree structures below.
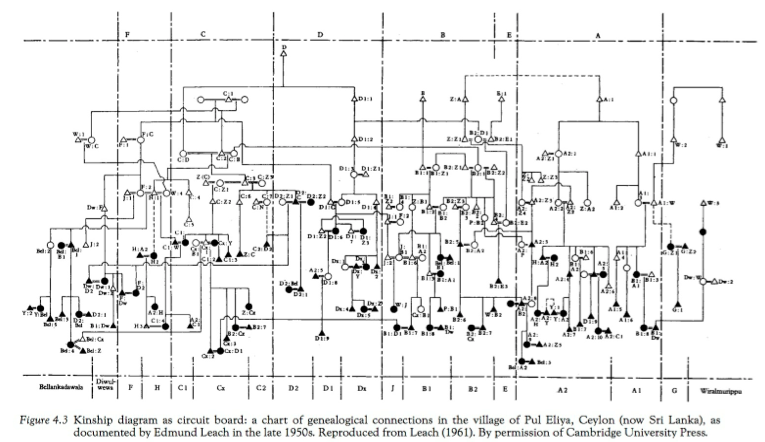
1) Kinship Family Tree diagram. *(We have to be both an electrical engineer and an Anthropologist to understand what's happening here). The use of shape here also reduces the clarity of hierarchy.
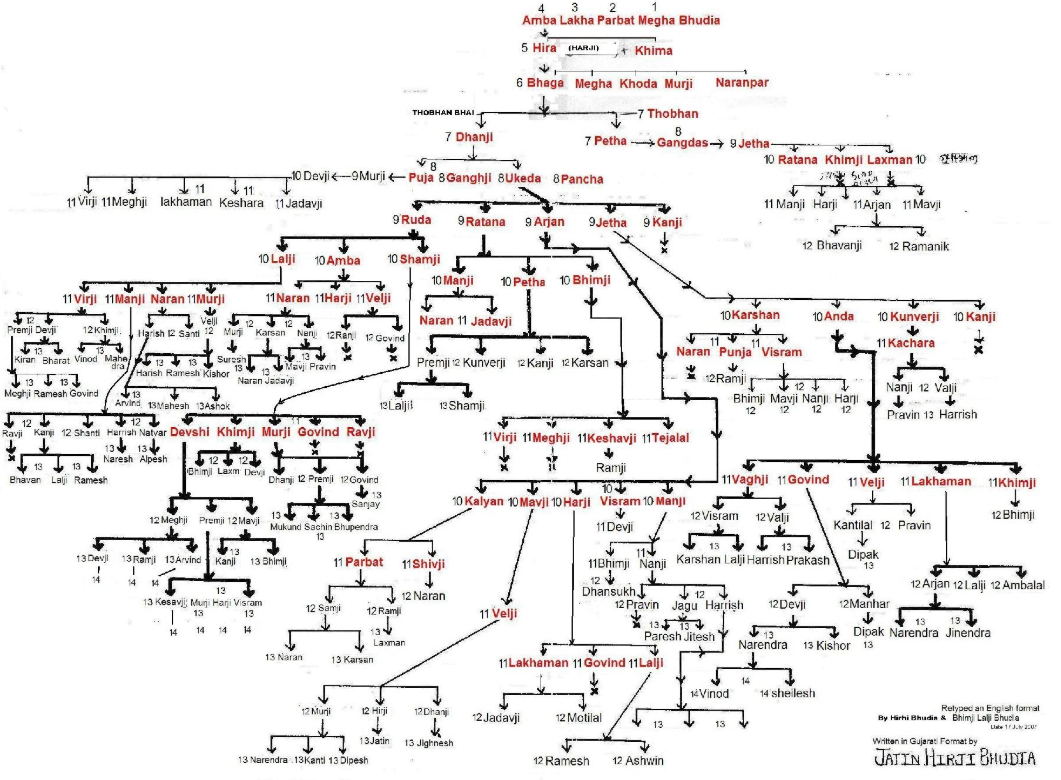
2) Kinship charts- Again, highly encoded and specialized knowledge required. Also has no single root node, and appears as though 1,2,3,and 4 are on the same level to start.
3) Essai d'une distribution généalogique des sciences et des arts principaux" by Christian Friedrich Wilhelm Roth (1769). Perhaps it's just a matter of information overload and the difficulty of telling one branch from another on the tree. "Spatial discord" from orientation comes to mind--though it is also beautiful and information-rich.
The Graph
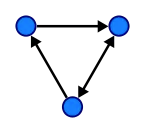
Graphs can take many forms, but ultimately they are non-linear structures which are composed of nodes (or vertices in Blue below) and edges (made up of the arrows).
Essentially we are looking at a network of connected nodes. Here is a simple small-sized version.
A History
The beginnings of the branch of mathematics called Graph Theory (as well as Topology), seems to have appeared after 1736 when the mathematician Leonhard Euler proved the Königsberg Bridge Problem to not be possible.
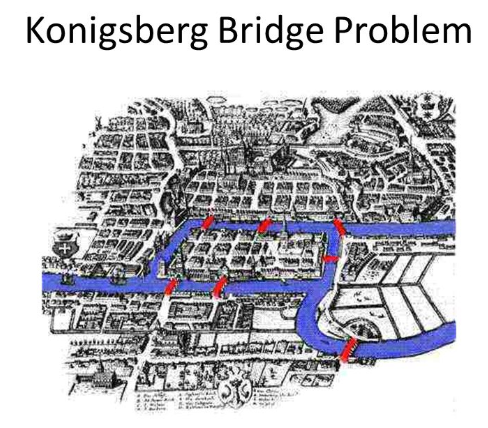
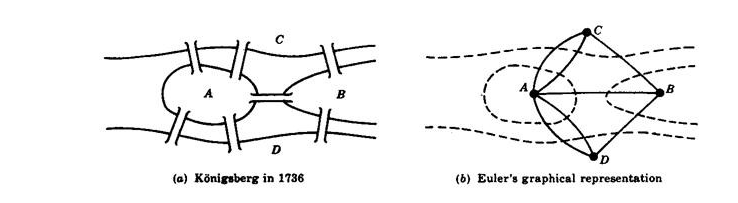
Briefly the problem was to walk over all of the seven bridges in the Prussian city of Königsberg only once. Euler came up with the following representation (b) to prove that is wasn't possible.
Graphs Used Today
There are many types of graphs used today (i.e. directed, undirected, cyclic, acyclic, and weighted to name a few). Each has its own composition and inter-relatedness. Use cases might include visualizing or calculating travel routes, road links, distances covered, aircraft flight paths, personal or professional networks, as well as many other scenarios. The use of position, color, and size seem to be important.
Let's take a look at some real world representations of graphs.
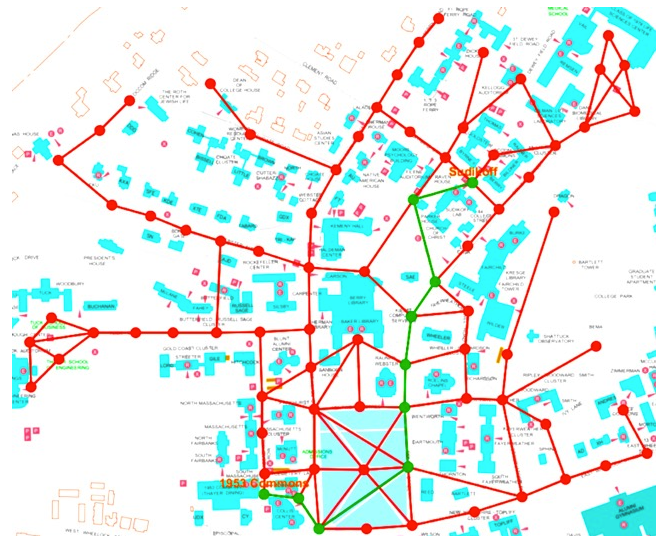
1) Here we see a route that is mapped out in green as the quickest way between two points using a graph. Here the use of color allows us to see the path immediately (as long as one doesn't have red/green color blindness).
2) A more complicated graph measuring votes and connections in German parliament over time. Color informs the connections alongside the legend.
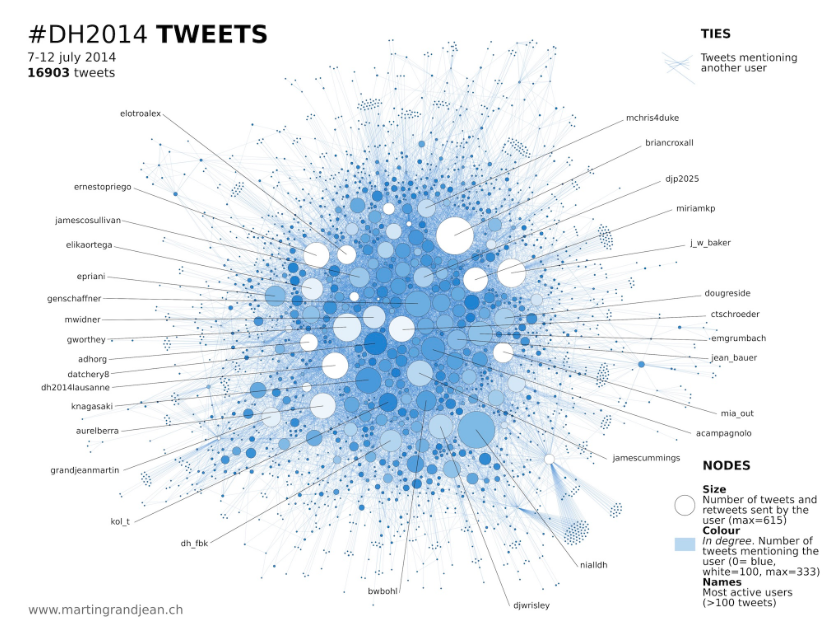
3)Following a network, volume, and authorship of tweets using a graph. Size and color used in each node.
Some Difficult to Decipher Graphs
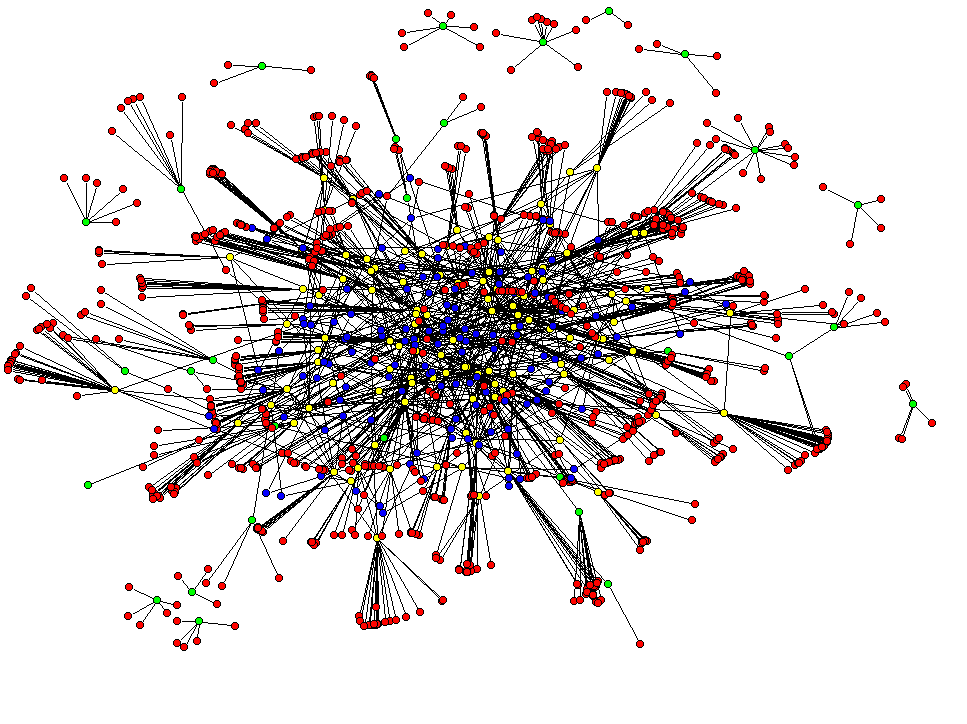
1) Here we see no labeling or legend indicating the relationship between colors of the nodes. Positioning and disconnected nodes remains difficult to create meaning.
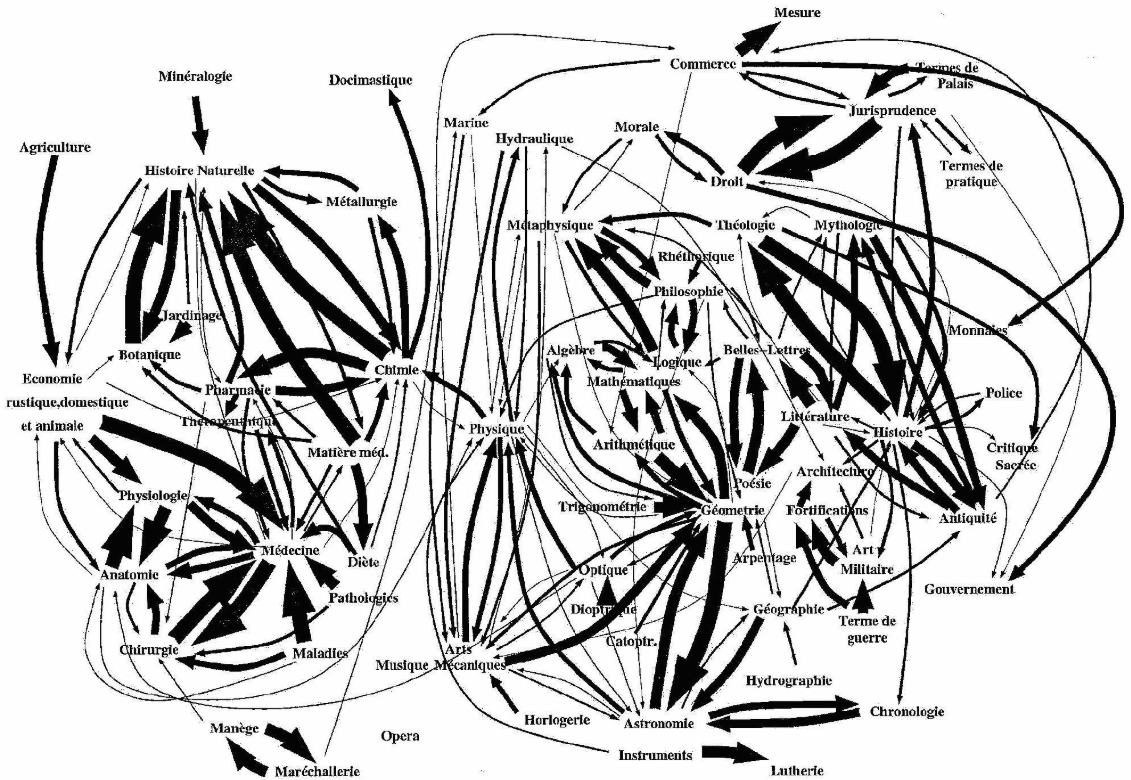
2) The use of thickness of arrows(possibly texture and size, and the meaning represented by each arrow) adds to the confusion of this knowledge graph. Not to mention the groupings, orientation, and positioning.
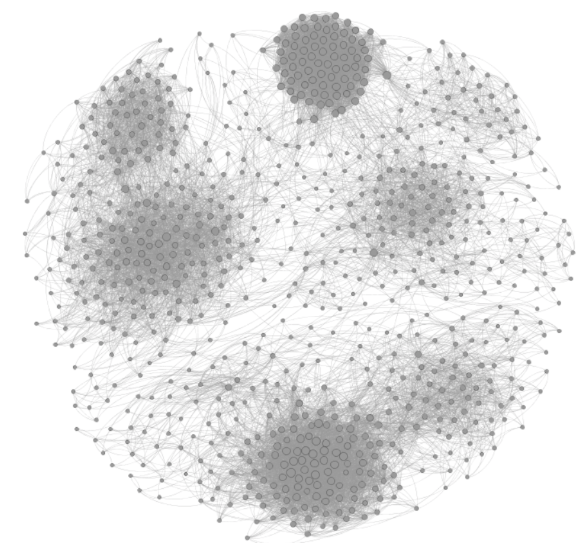
3) The lack of labels and use of grayscale makes it a poor representation to intuit anything about the graph below. The clustering however is effective, but no insight can be gathered about the relationship of the clusters again without a legend.