Intro to Tree Maps
- Tree maps usually represent a hierarchical structure of a large amount of data in the form of the size of rectangles and color scale. It provides a clear view of the complexity of the data and the comparison among different types of data. However, it is not useful to find out the details of each type of data, because numbers and names take too much space to fit into each rectangle. It is also very difficult to see the exact percentage of each category.
- Pre-processing
- Choose colors for each level.
- Determine the size of each level.
- Numerical values are converted into sizes and colors.
Good use case of Tree Maps
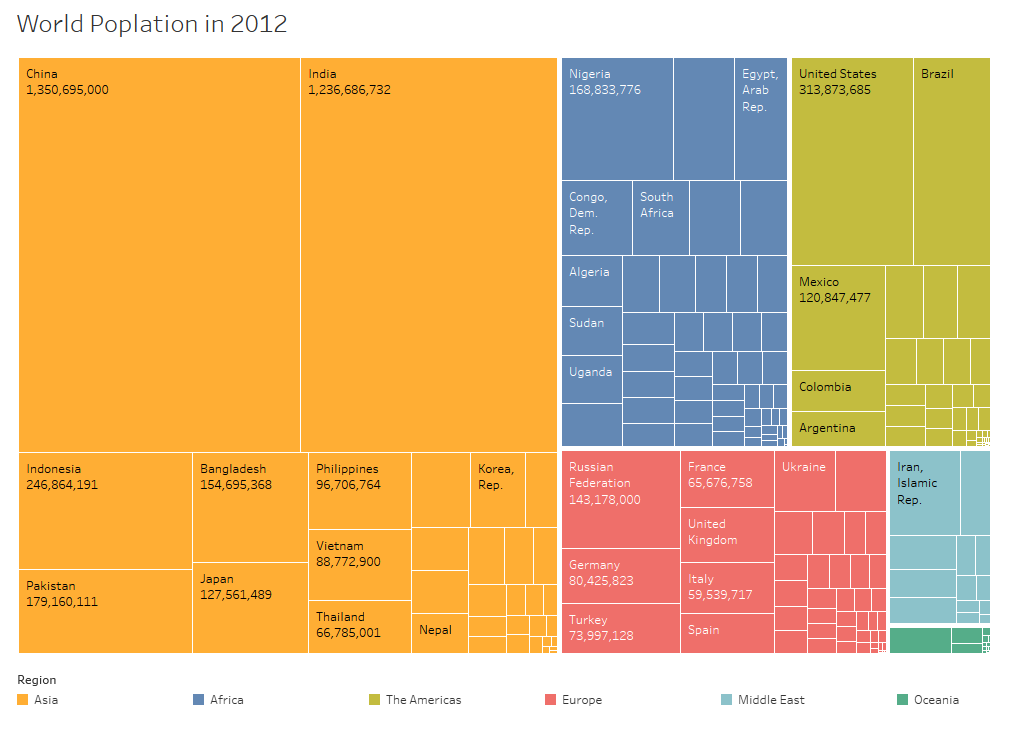
The diagram above shows country names and population of the countries. With the tree map, it is easy to discover which countries has the largest population.
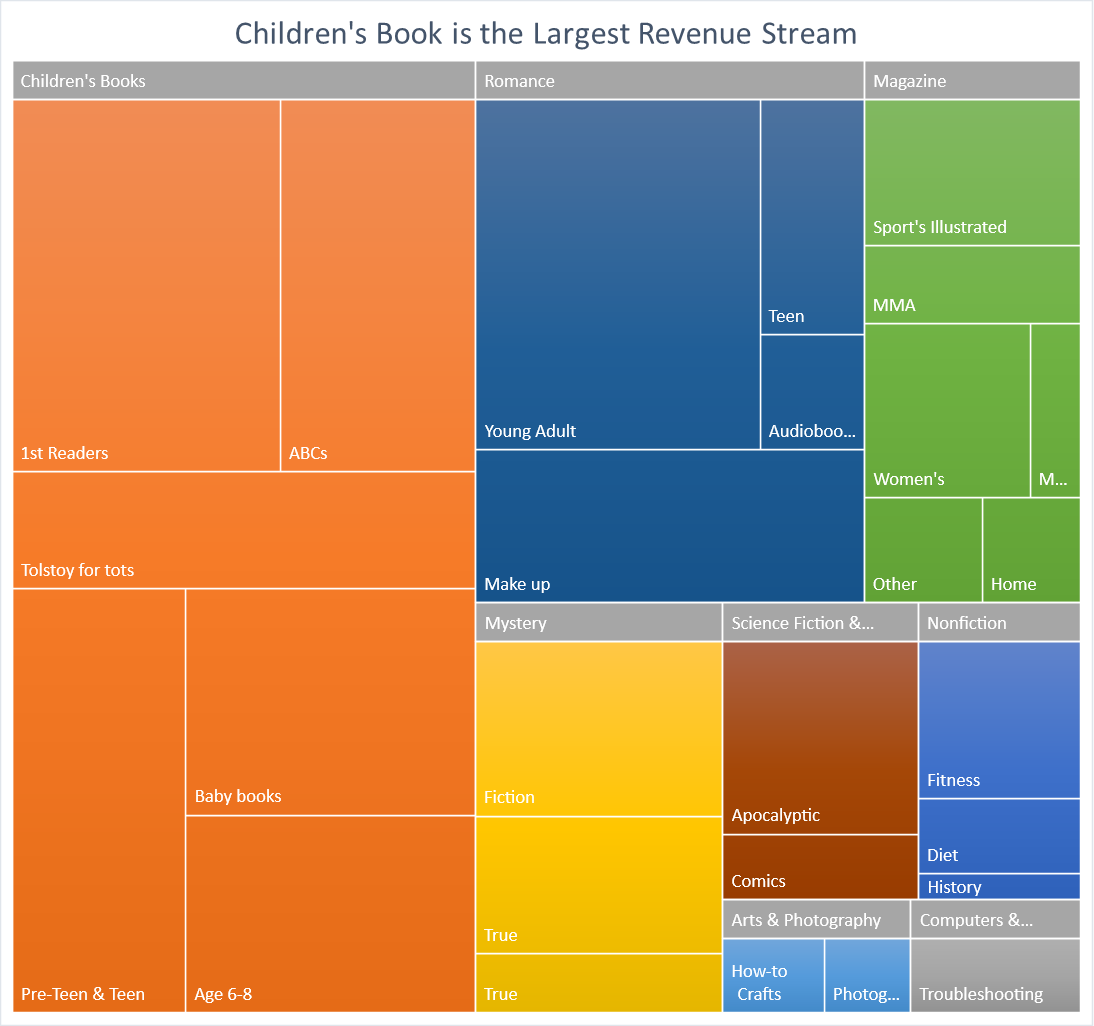
The diagram above clearly shows the types of book that brings the largest revenue with the use of the tree maps and the distribution of the audience.
Bad use of Tree Maps
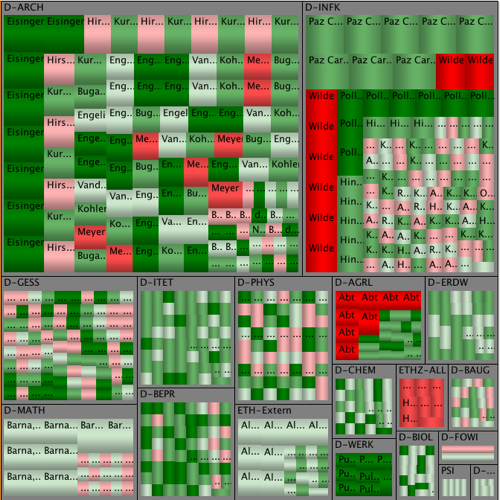
It is difficult to see the hierarchy on the picture above due to the sizes of different categories are similar.