In Subtleties of Color, Robert Simmon emphasizes different functions that colors play in data visualization. Choosing colors for a data visualization is not just simply looking for random color combination from any color palettes. Instead, an appropriate use of colors could improve the meaning, clarity, storytelling, and readability behind the data visualization.
The section that I found the most interesting is Connecting Color to Meaning. Robert Simmon raised the idea of intuitive colors, which could help non-experts interpret the data visualization based on their perceptual understanding. The example Robert Simmon presented is two satellite visualizations in different color uses.
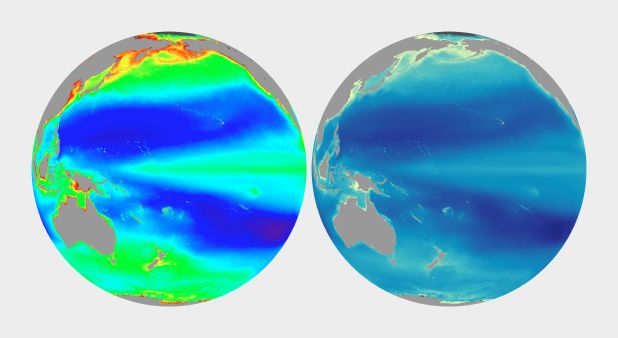
The example on the left is a satellite visualization that scientists normally view, with rainbow palette. However, it became difficult for novice viewers to understand the meaning of each color because the meaning of the rainbow colors here have a different meaning compared to what non-experts understand. It is easy for them to relate warm colors and cold colors to temperature- red, orange, and yellow represent hot and blue for chilly. When transferring the unnatural colors of the rainbow palette into the example on the right for phytoplankton, the confusion could be somewhat ignored- dark blue for ocean, the gradient of turquoise, green, and yellow for increasing concentrations of plans and algae.
These blogs remind me of an article about using semantically-resonant colors to represent data I read before. I think when applying these concepts into data visualization, we also need to consider how the meaning of colors varies in different culture. For example, in the U.S., we commonly use red for decreasing and green for increasing in stock. However, in China, we would use the opposite colors.