Robert Simmon is a data visualizer for NASA, so his primary output of work is within the Earth and natural sciences. In this series of essays, he writes about color theory and the various considerations one must make before beginning to visualize data. The first thing he did was introduce us to the origin of the use of color to visualize data which gives us an interesting link to his work and the early cartographers who pioneered the effective use of color in data representation. This makes sense. Cartographers have the privilege of having a large canvass to display a wide variety of data that could also include a naturally occurring diversity in color(s) that could simultaneously be universally understood: hot is red like fire, water is blue and refreshing, land is green if there is vegetation or various shades of brown if it’s arid land mass, and white and light blues for snowy tundras, etc.
In thinking about this author’s perspective, it takes me back to a moment in Kieran Healy’s article “What Makes bad Figures Bad” where he says this about the one of the common problems that plague the field of data visualization; “Some [problems] are strictly aesthetic. The graph we are looking at is in some way tacky, tasteless, or a hodgepodge of ugly or inconsistent design choices”. At first I balked at that assertion. As someone who tends to root for the underdog, I am naturally inclined to defend those who may not care about aesthetics. And hey, as long as the data is real and true, why should it matter what it looks like? I found myself trying to avoid getting caught up in conforming to beauty standards, but this is not up for debate. In data, aesthetics matter and should not be considered disposable.
There are many things that one must consider prior to picking the palette that will represent the data that you want to visualize. You have to consider the data itself, the audience that you are targeting or representing, the viewers genetics (e.g. color blindness), the cultural and subcultural references, personal taste, as well as the story that emerges from the data. There are three primary types of data and he goes on to provide reasoning for why color matters. First we must cover the three primary data types that he describes in this article: sequential, divergent, and qualitative.
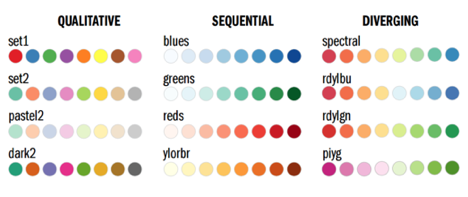
DATA TYPES
Sequential Data - This is data that continuously varies from a high or low value over time, like income, temperature, and music etc. For this type of data, he recommends a palette that varies evenly from light to dark, or dark to light, and requires a simultaneous change in hue and saturation.
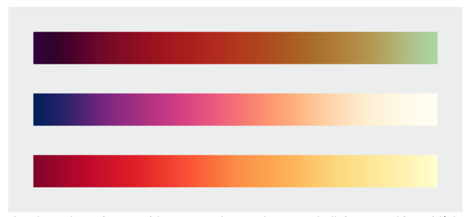
Example:
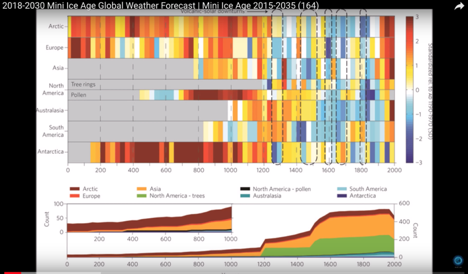
Finding a good real life example through a casual search was surprisingly hard. In the example below, they attempt to look back in time to predict the future of Australia's and our planet’s climate for the next 40 years. In fact it’s unclear to me if this can even count as sequential data. Thoughts?
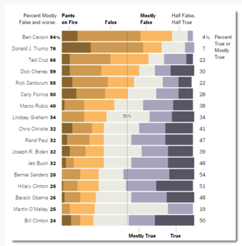
Divergent Data - This is data that has what he calls a “break point” in the center which signifies a (what I assume to be) a sharp difference, like population change, a departure from the average temperature, or even an electric charge! (I’m not entirely sure how one would visualize this or what kind of data this would show, but now I’m curious). In other words, it shows a departure from the norm. In this case, a palette that has two different hues that vary from a central neutral color.
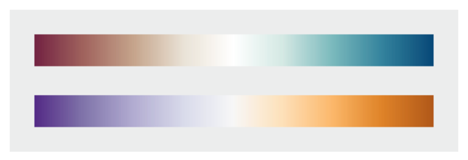
Example:
It was initially difficult for me to imagine how this type of coloration would play out in a visualization, so I looked for examples, and this stacked bar chart is a great tool to use in this manner.
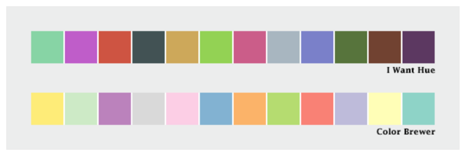
Qualitative Data - This data type requires that the information be broken down into discrete classes or categories, which can then have color applied to them. In this case, the use of “intuitive colors” are probably best suited for this data, as qualitative data includes the personal accounts of people so applying colors to various categories and sub-categories should without question, be inclusive of the people/population being observed. It is advisable not to use more that 12 colors but in the case where there are more than 12 categories, it makes sense to group related data with related colors - like one big happy family!
Example:
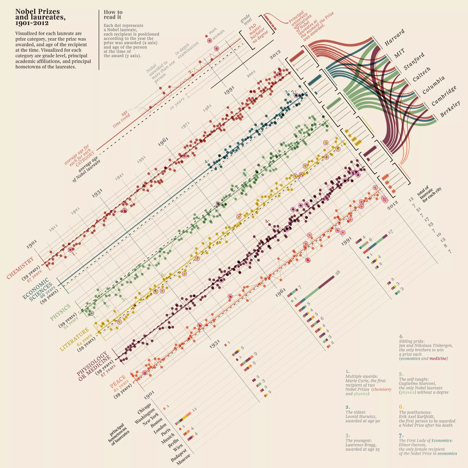
Fantastic example of how to use color to visualize qualitative data in this multivariate graphic that details the history of Nobel prize winners between 1901 - 2012.
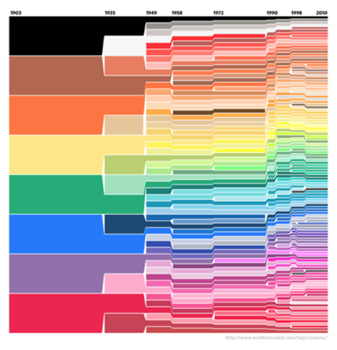
And check out this visualization of Crayola’s crayon colors from 1903 through 2010!
Binary data?
Oddly left untouched in his essay. Perhaps it's unimportant in the grand scheme of things?
Important Considerations:
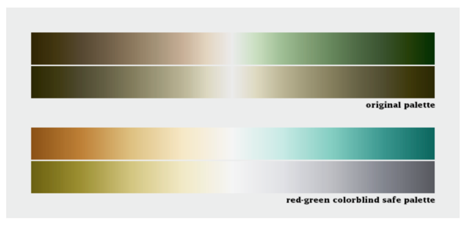
The relationship between the light humans beings see and the colors we perceive is complex. To this end, it is always important to consider color blindness in your designs.
And last but certainly not least, Just Say No to these tired old palettes!
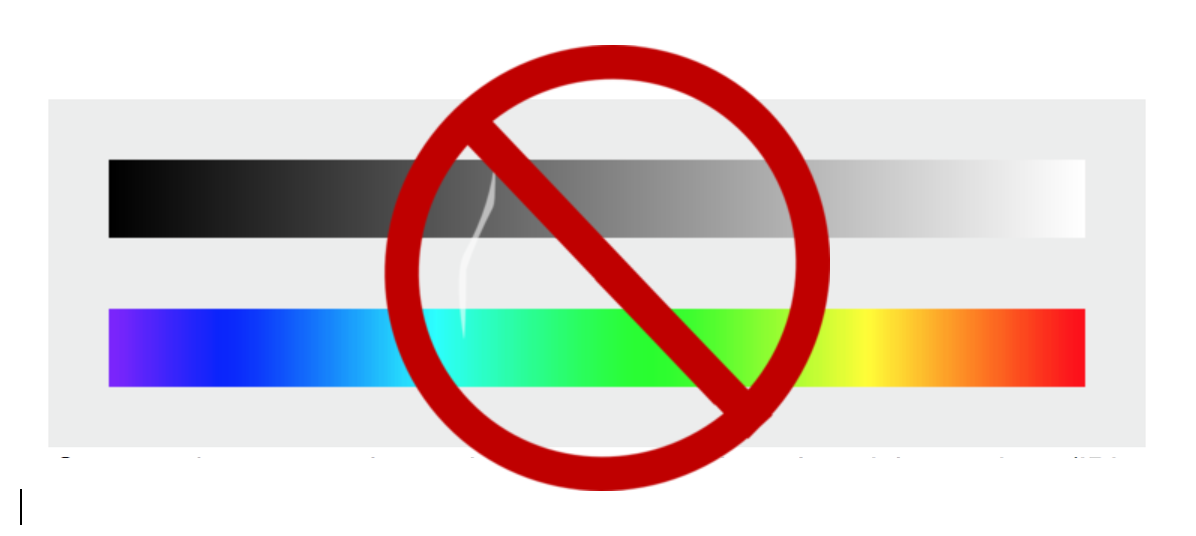
The grayscale & rainbow palettes we all grew up with have limited color ranges because computers process color in RGB, so when they are used to represent data, it becomes very easy to obscure data or even mislead people. It is our job to “illuminate data”, not hide it.