What I like about the second chapter of Drucker’s Graphesis is how she draws timelines of different lineages of information visualizations and the overall arc of these lineages that finally leads her to her own vision of a humanist / constructivist approach to data visualization.
After getting familiar (maybe too familiar) with her method – first identifying what appears to be familiar, normal or natural and understanding that it’s actually result of human conception rendered opaque by convention; followed by tracing its history and origin, incentives and agendas in its development to finally be able to find new forms of representation that make these processes more transparent – I tried to focus more closely on the huge list of examples she structures in seven categories:
- Timekeeping
- Space-making
- Administration and record-keeping
- Trees of Knowledge
- Knowledge generators
- Dynamic systems
And finally a category for her own vision of “humanistic” visualizations:
- Visualizing uncertainty and interpretative cartography
Even though it’s not directly related to visualization practice, I wanted to start with a few remarks on her method. While I agree with her approach and think it’s generally a valuable exercise to de-normalize what is understood to be data in it’s most basic meaning – given – I sometimes wished for a more comprehensive argument and some reflection on her own position. For example when she repeatedly states that spatial organization was an important tool to solve previously unmet challenges it would have been interesting and helpful if she provided more insights into her research in which way positioning and spatial organization actually conveyed meaning or helped solve problems. While she did this roughly for addition organized in columns, and I can try and unravel what she means by claiming that Babylonian development of multiplication and division would have been “impossible to perform without spatial organization in which the numbers hold value through position.” (p. 84), the fact that she doesn’t account for the statement disincentivizes questioning it. Maybe there could have been other ways to organize thought to conceive these operations. In other cases, her claims are so general that I would need to follow her research beyond the scope of her book to really understand how space organized meaning.
After reading about her vision of visualizing uncertainty and interpretative cartography I really appreciated the groundwork she laid out in the previous sub-chapters. For example deconstructing the idea of linearity of time and its scales and measurements then finally makes sense when it’s the foundation to find new ways to represent a timeline.
What I find really helpful for a visualization practice is to identify the graphical conventions and their connotations to think about the possibility if the data one wants to visualize might allow to depart from these conventions. And it’s also really helpful that she identifies normalized concepts on different levels and different degrees of abstraction. The following list includes just a few examples that stuck with me and is by no means exhaustive:
- Timekeeping: Most measurements have a link to human time perception, for example the day – night cycle, but an hour is a totally arbitrary scale.
- Spacemaking: Positioning on a map doesn’t have to encode spatial information (see the example of Tom Carden mapping travel time to distance: http://www.tom-carden.co.uk/p5/tube_map_travel_times/applet/)
- Trees of knowledge & trees of life come with a set of ideas about a single point of departure, inheritance and hierarchy. It was revealing to me to read that one of the original uses actually used the tree metaphor top down and not bottom up. Another interesting fact is that through changing the orientation Ramus established this factor as a distinguished diagrammatic property. The use of an organic metaphor to represent lineage of power is also a (sub-?)conscious decision to naturalize hierarchies. Makes me wonder how you can avoid these metaphors in your own work.
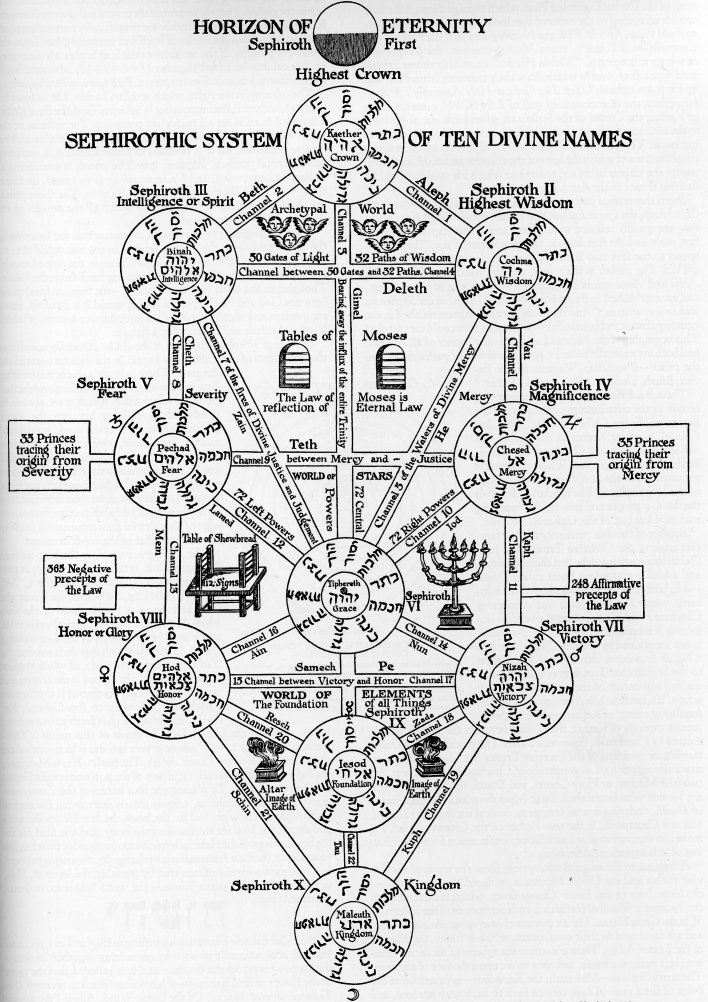
- Knowledge generators: I really enjoyed seeing theses examples and that a lot or the first uses were spiritually or religiously motivated, as tool to ignite theological contemplation, spiritual advice or encoding rituals.
- Dynamic systems: In this chapter it was very interesting how the development of meteorology was almost in symbiosis with the advancement of visualization strategies for weather variables and how military interests played an important role to further this development. It is interesting that due to it’s complexity Drucker sees weather visualizations as a point of reference for her idea of humanistic information visualizations.
While I find her last sub chapter fascinating and motivating to approach data visualization differently it also motivated me approach her project with her own method which raised a lot of questions for me:
Why does Drucker conflate humanism with constructivism? What ideas are conveyed and connotated when some types of of graphical tools are called knowledge-generators? How do we find out about the agenda of the author? Or is the own agenda always to some extent opaque to the author? When criticizing conventional ways of visualizations why does Drucker assume a realistic approach (p. 126), when it’s quite possible that it’s just a pragmatic one? When reinventing Snow’s chart of deaths from cholera for example, Drucker imagines a lot of different layers, how would we find out about the various different purposes of this chart, what would the overall purpose of it be and would it still enable us to track the source of the epidemic to a single water pump?
At the end I was a bit disappointed by the examples she decided to show for the new humanistic approach to visualization. It falls behind her ambitious description.