In the Subtleties of Color series Robert Simmon provides an insightful and pragmatic overview to the issue of color in data visualizations. Throughout the articles Simmon presents a number of practical heuristics to approach the selection of color palates for data visualizations along with an arsenal of tools to facilitate color selection.
One interesting example that Simmon gives to set the scene very early on is the below example - which shows the pain of coloring visualizations in a bygone era. Designers of this visualization were essentially coloring by numbers to come up with colored data visualizations for NASA. I liked this example as it sets the scene for how lucky we are today:

Key takeaways for me from the series were:
Algorithmic vs. Humans
The visible light spectrum is often the starting place for thinking about colors, however, Simmon discusses that all colors in the spectrum are not equally distributed. Many of the subsequent points that Simmon focuses on relate to this issue and the need to select color spectrums with human perspective in mind (inclusive of accessibility issues). For me this focus was a major insight on how to think about color theory and the application thereof.
Connecting Color to Data
Perhaps the most critical point from the articles is the need to connect color with data. Through a series of examples Simmon is able to easily show the importance of this connectively and the impact of deviations from this concept. At its most basic level he is saying if you are using color, make sure you have thought about your choices, and why they are enriching the presentation of the data and the data storytelling.
Different types of Data
Simmon digs into one issue that I have often seen badly executed in practice, and that is different color strategies for differing data types. Simon discusses the implications of matching the color strategy for the visualization to differing types of data, namely: sequential, divergent, and qualitative.
Intuitive
On this issue Simmon expressed the simple rule - that color selection should be intuitive. Water should be blue for instance, as shown below:

The importance of this rule really comes down to the ease and speed of interpretation of a data visualization. If the designer can leverage a priori assumptions from the reader, the ease of interpretation is facilitated.
Emotional and Cultural
However, with the above said Simmon also touches on the need for the designer to be sensitive to the emotional and cultural significance that colors may bring. I've personally, had the experience of presenting a data visualization in China which used red as "bad" and this didn't go down well with the audience.
Practical Resources
While the blog series and lecture were exceptionally informative and a resource that I will use over time, some of the other resources that Simmon references for instance ColorBrewer are of exceptional pragmatic value and have been bookmarked.
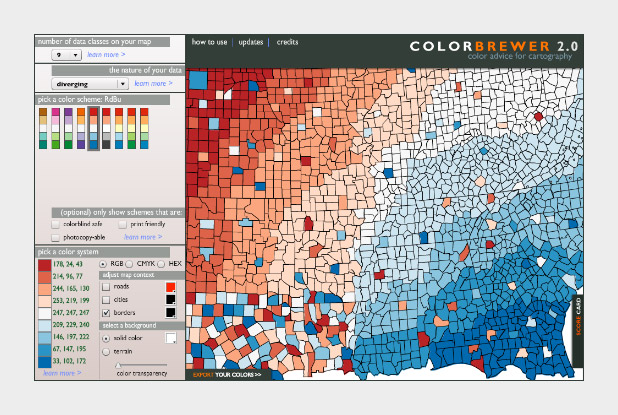
In my revised version of assignment 2, I've leveraged various color spectrums from ColorBrewer in the visualizations - I'd expect that this is a tool that will be utilized often going forward.
Overall
I thought this was an exceptionally valuable reading, with massive pragmatic value, with enough reference to theory to make it a good launchpad for further readings on color theory.