In chapter two, Interpreting Visualization Visualizing Interpretation, Drucker describes various graphical formats, such as maps, tables and charts, to dive deeper into the study of visualizations. In the beginning of the chapter, Drucker makes an important distinction between visualizations that are representations and those that are knowledge generators. While representations are static and present information that is already known by the viewer, knowledge generators are dynamic and have the ability to create new information. A key element Drucker points out is that all visualizations and diagrams rely on three distinct principles:
- The rationalization of a surface
- The distinction of figure and ground
- The delimitation of the domain of visual elements so that they function as a relational system
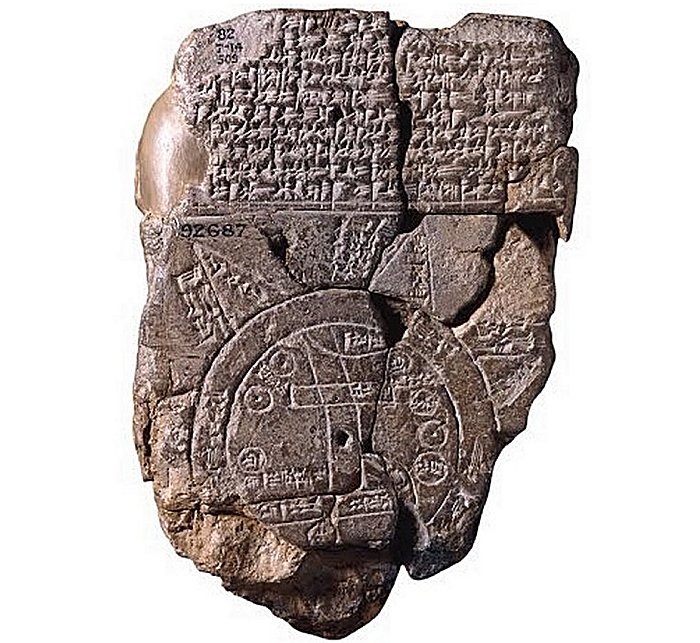
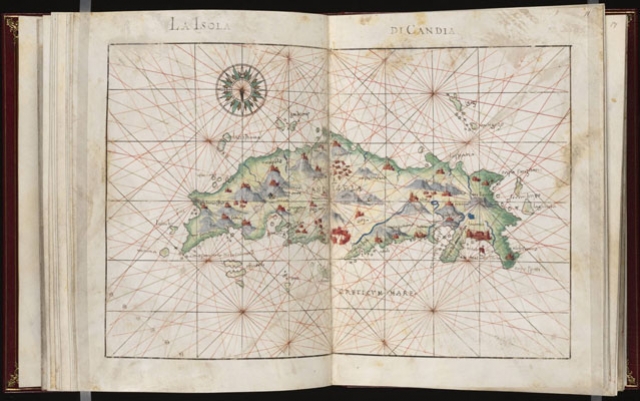
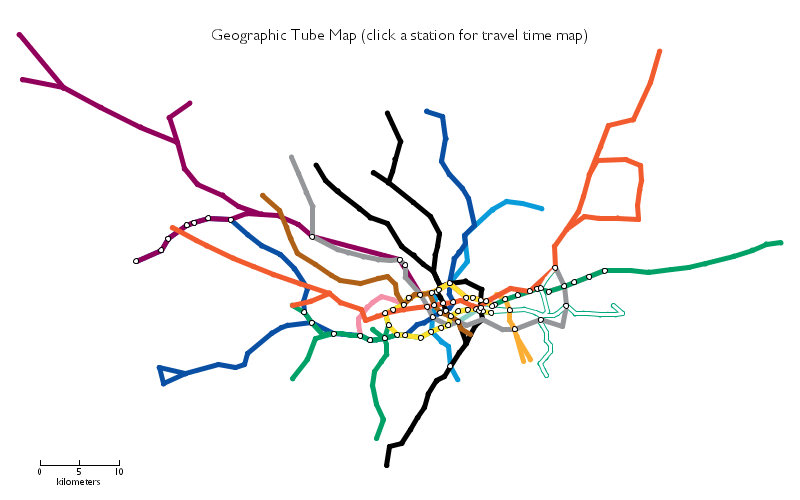
Throughout the chapter, Drucker takes the reader on a journey from the origins of visualizations, beginning with timekeeping. Timekeeping is the earliest form of a chart or diagrams and was essentially created in 2100 BCE in the ancient Mesopotamian region. However, Drucker argues that the idea of time is highly subjective as the “share of temporality is an expression of belief, not a chart of standard metrics. Drucker then describes space-making which is essentially about creating spacial representation without using prior coordinates to structure the representation. This leads Drucker to explore the history of Maps using various examples including Portolan Charts and Tom Carden’s London Underground Map. Following this, Drucker goes into Administration and Record Keeping which looks at the arrangement of information into tables, as demonstrated by the use of clay tablets to separate signs of different types in the fourth millennium. Another type of visualization discussed in the chapter are Trees of Knowledge which are commonly used in databases and structured data files. This is primarily due to the fact that trees of knowledge are static and fixed but also carry meaning in them. Similarly, knowledge generators are also static but can be mobile as well. Knowledge generators support “combinatoric calculation”, meaning their features allow their components to be combined in many different ways. Lastly are dynamic systems, consisting of dynamic elements such as vectors and graph lines, which result in the display of processes rather than products.
Drucker ends the chapter by discussing "visualizing uncertainty", taking into account that assumptions and rhetoric are often attached to visualizations. She also discusses humanistic methods which shift away from standard metrics and statistical graphics and lean more towards interpretative graphics. In the final part of the chapter, Drucker proposes a new model for humanistic work that can be applied across various domains. She uses the example of the shift from observer-independent realism to co-dependant constructivism to solidify her proposal.