Descriptions
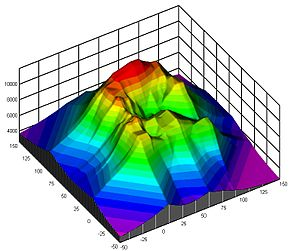
Rubber Sheet
https://en.wikipedia.org/wiki/Rubbersheeting
Like a heat map but used to map four or more dimensions through the use of a colored, three dimensional surface.
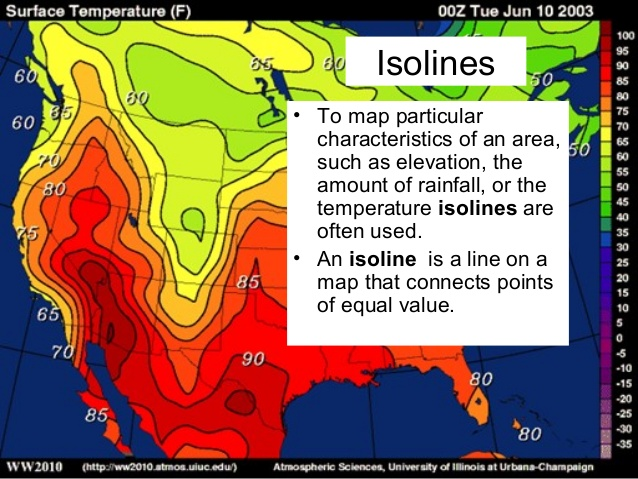
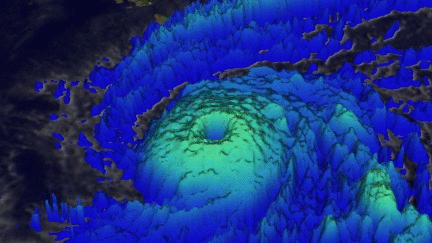
Isosurfaces
https://en.wikipedia.org/wiki/Isosurface
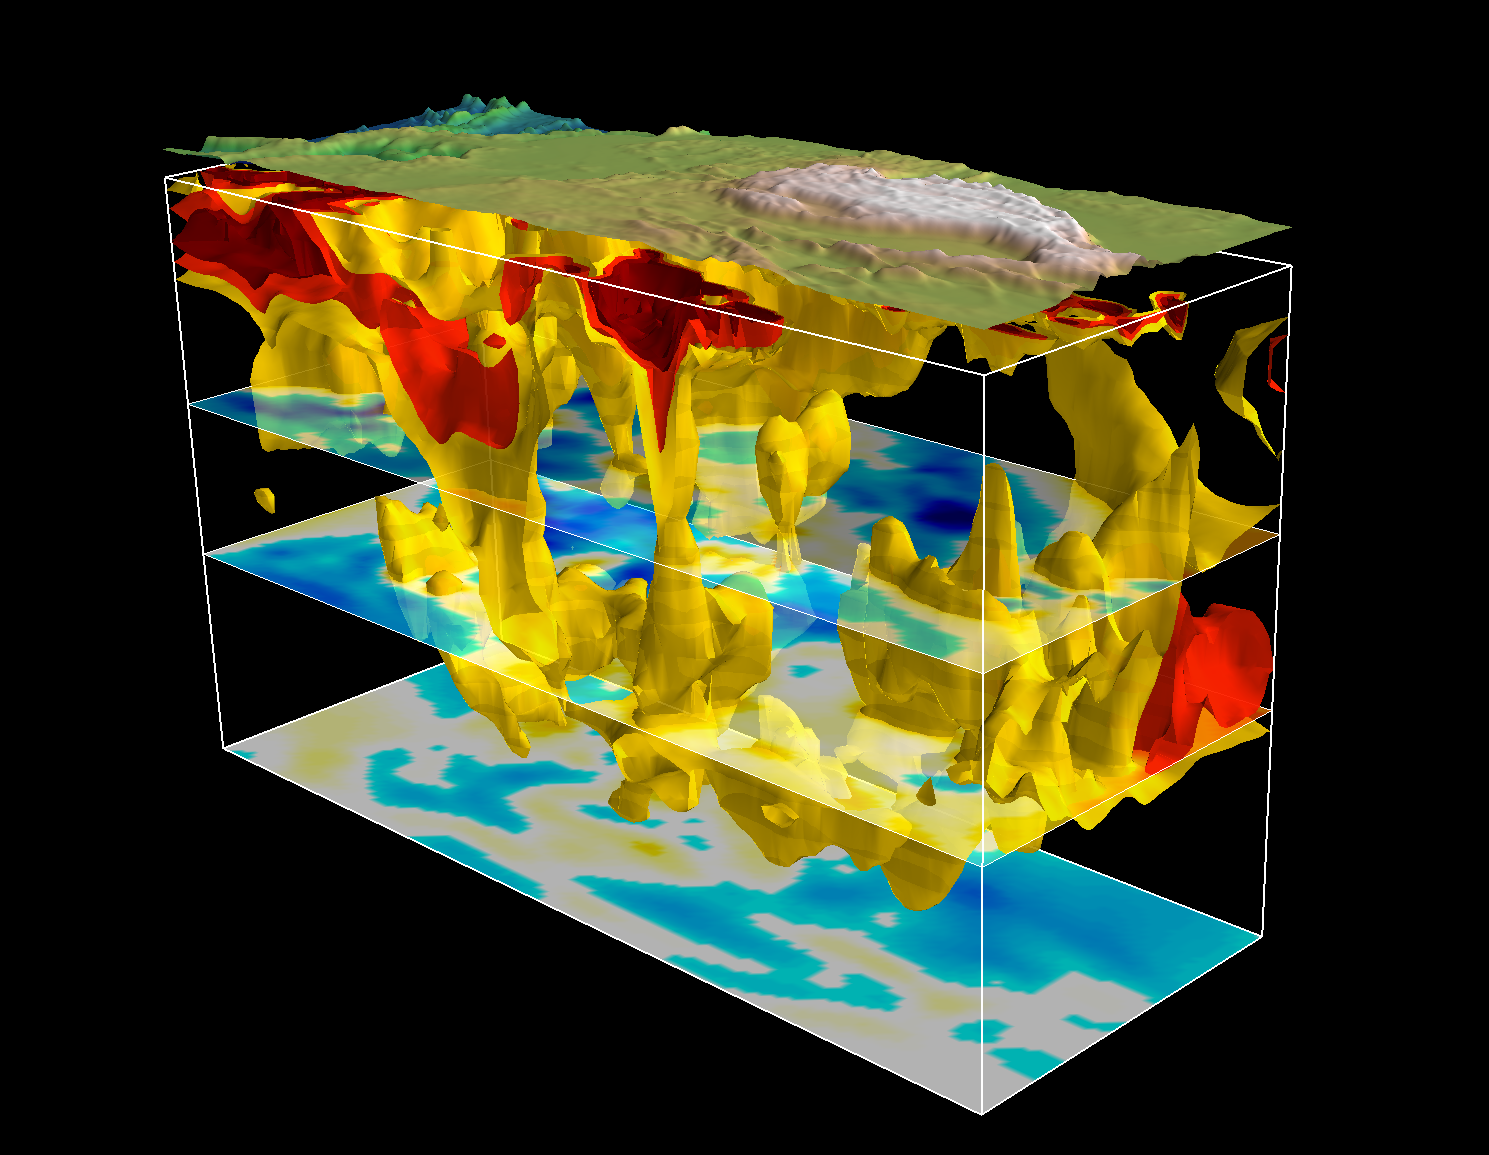
Map of data that resemble topographic maps. An isosurface is a three-dimensional analog of an isoline. It is a surface that represents points of a constant value (e.g. pressure, temperature, velocity, density) within a volume of space; in other words, it is a level set of a continuous function whose domain is 3D-space.
Uses
Good for...
plotting concentration, area, depth, altitude encourages: comparison of height, general landscape. Perhaps most often seen as weather maps. Measuring space is more efficient than measuring color.
Not so good for...
Imprecise. data resolution might influence understanding of numbers. Ambiguity about what colors represent and thresholds. How does resolution of data influence meaning?
Ideas: model economies, temperature, belief/political systems
Function
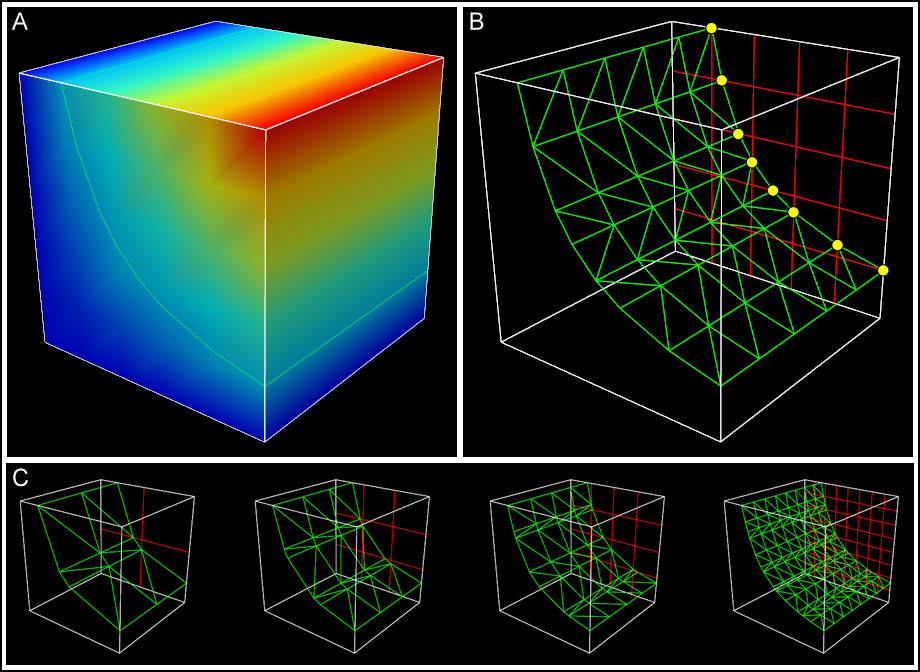
Why extrude from isoline to isosurface? For greater clarity about value meaning. Adding height and depth might communicate more about value differences than color and numeric valued.
Extruding from isoline to isosurface
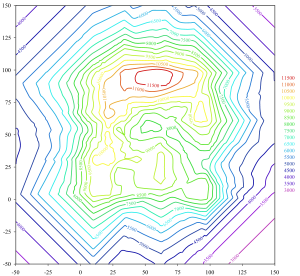
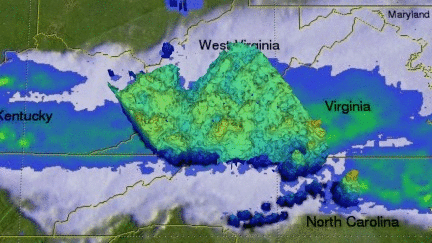
Commonly used to represent weather systems
How does the resolution of data affect our interpretation?
The designer is making decisions about the coarseness of data representation and has enormous power to influence the message. Ex. a map of ethnicities represented in the United States that only has 3 inputs will communicate a very different message than the same map with 10 inputs.
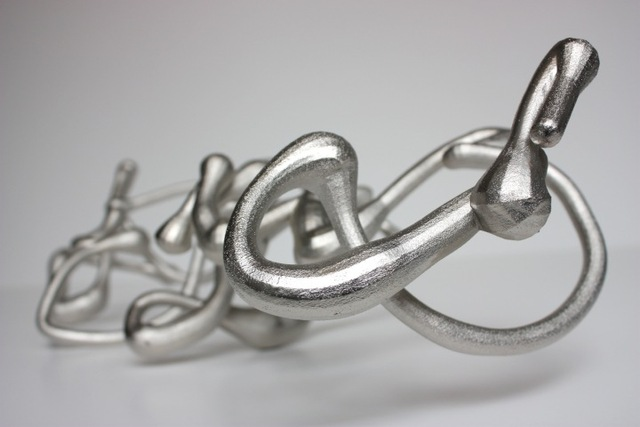
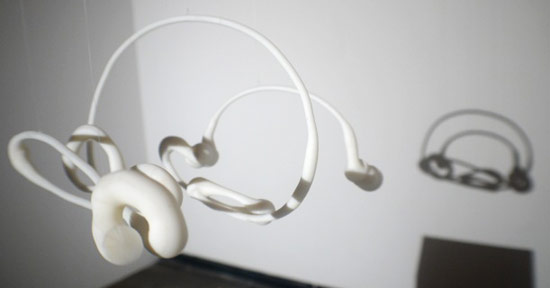
Is Evan Roth's work an isosurface?