Graphesis
by Johanna Drucker
Read the second chapter: Interpreting Visualization :: Visualizing Interpretation. Also consult the relevant 'plates' in the Windows section.
Use the tag “R4” for your post.
Graphesis
by Johanna Drucker
Read the second chapter: Interpreting Visualization :: Visualizing Interpretation. Also consult the relevant 'plates' in the Windows section.
Use the tag “R4” for your post.
The chapter Interface and Interpretation in Graphesis covers the concept of interface (or more specifically, human computer interface) in the context of history, functionality, theory, and design. What stood out to me were two things: Drucker's interpretation of the interface as more than just a structure of organization or a portal, and her tracing of the interface from when manuscripts first came to be to the digital age now.
The interface, conventionally seen as merely a means to an end, a stable organizational form, is more than just that--it is a mediating environment that interacts with us as subjects, it is a set of possibilities that we engage with to constitute experience, it is governed by probability and perception just as much as information itself is. I was particularly interested in the details of humanistic interface: "interface design that incorporate humanistic principles in their organization." I was surprised to read that what I thought was humanistic interface, human-centered design (basically user experience/user interface design), was not what I thought it was. Drucker states that the standard theory of interface based on the "user experience" is set on a goal to "design an environment to maximize efficient accomplishment of tasks--whether these are instrumental, analytic, or research oriented--by individuals who are imagined as autonomous agents whose behaviors can be constrained in a mechanical feedback loop." However, what is actually humanistic interface is to take into account all motivations, even those that are not goal-oriented, registering qualities of human experience into its design and facilitating new experiences by engagement with the interface.
I also appreciated the history of the interface, its origins in print with no structural organization or form. Features such as columns, table of contents, chapters, paragraphs--everything that we are familiar with now, only came to be because there was a need for scholarly discoveries and analysis. We have implemented these structures of print into digital environments, not because the technology necessitates this, but because conventions of print design. However, we must expand beyond that in our conceptualization of digital environments and consider what the "book of the future" would be. I think the possibilities of what we can do with information and datasets available to us are infinite--if we could create digital environments that allowed for deep exploration of these datasets, accounting for needs specific to them, there is the potential of so much discovery and reflection. The book of the future is a mediator of self-made discoveries, of diverging paths that lead us to many more experiences. The information is already there en masse--we need interface to advance in order to properly harness this information.
In this chapter, Drucker dives into the lineages of graphical representation. Firstly, she organizes graphical representation by type. She makes the distinction between visualizations that are representative of static information versus knowledge generators (visualizations capable of creating new information through their use). Then she categorizes by form (graphical format, purpose, meaning etc.).
Timekeeping
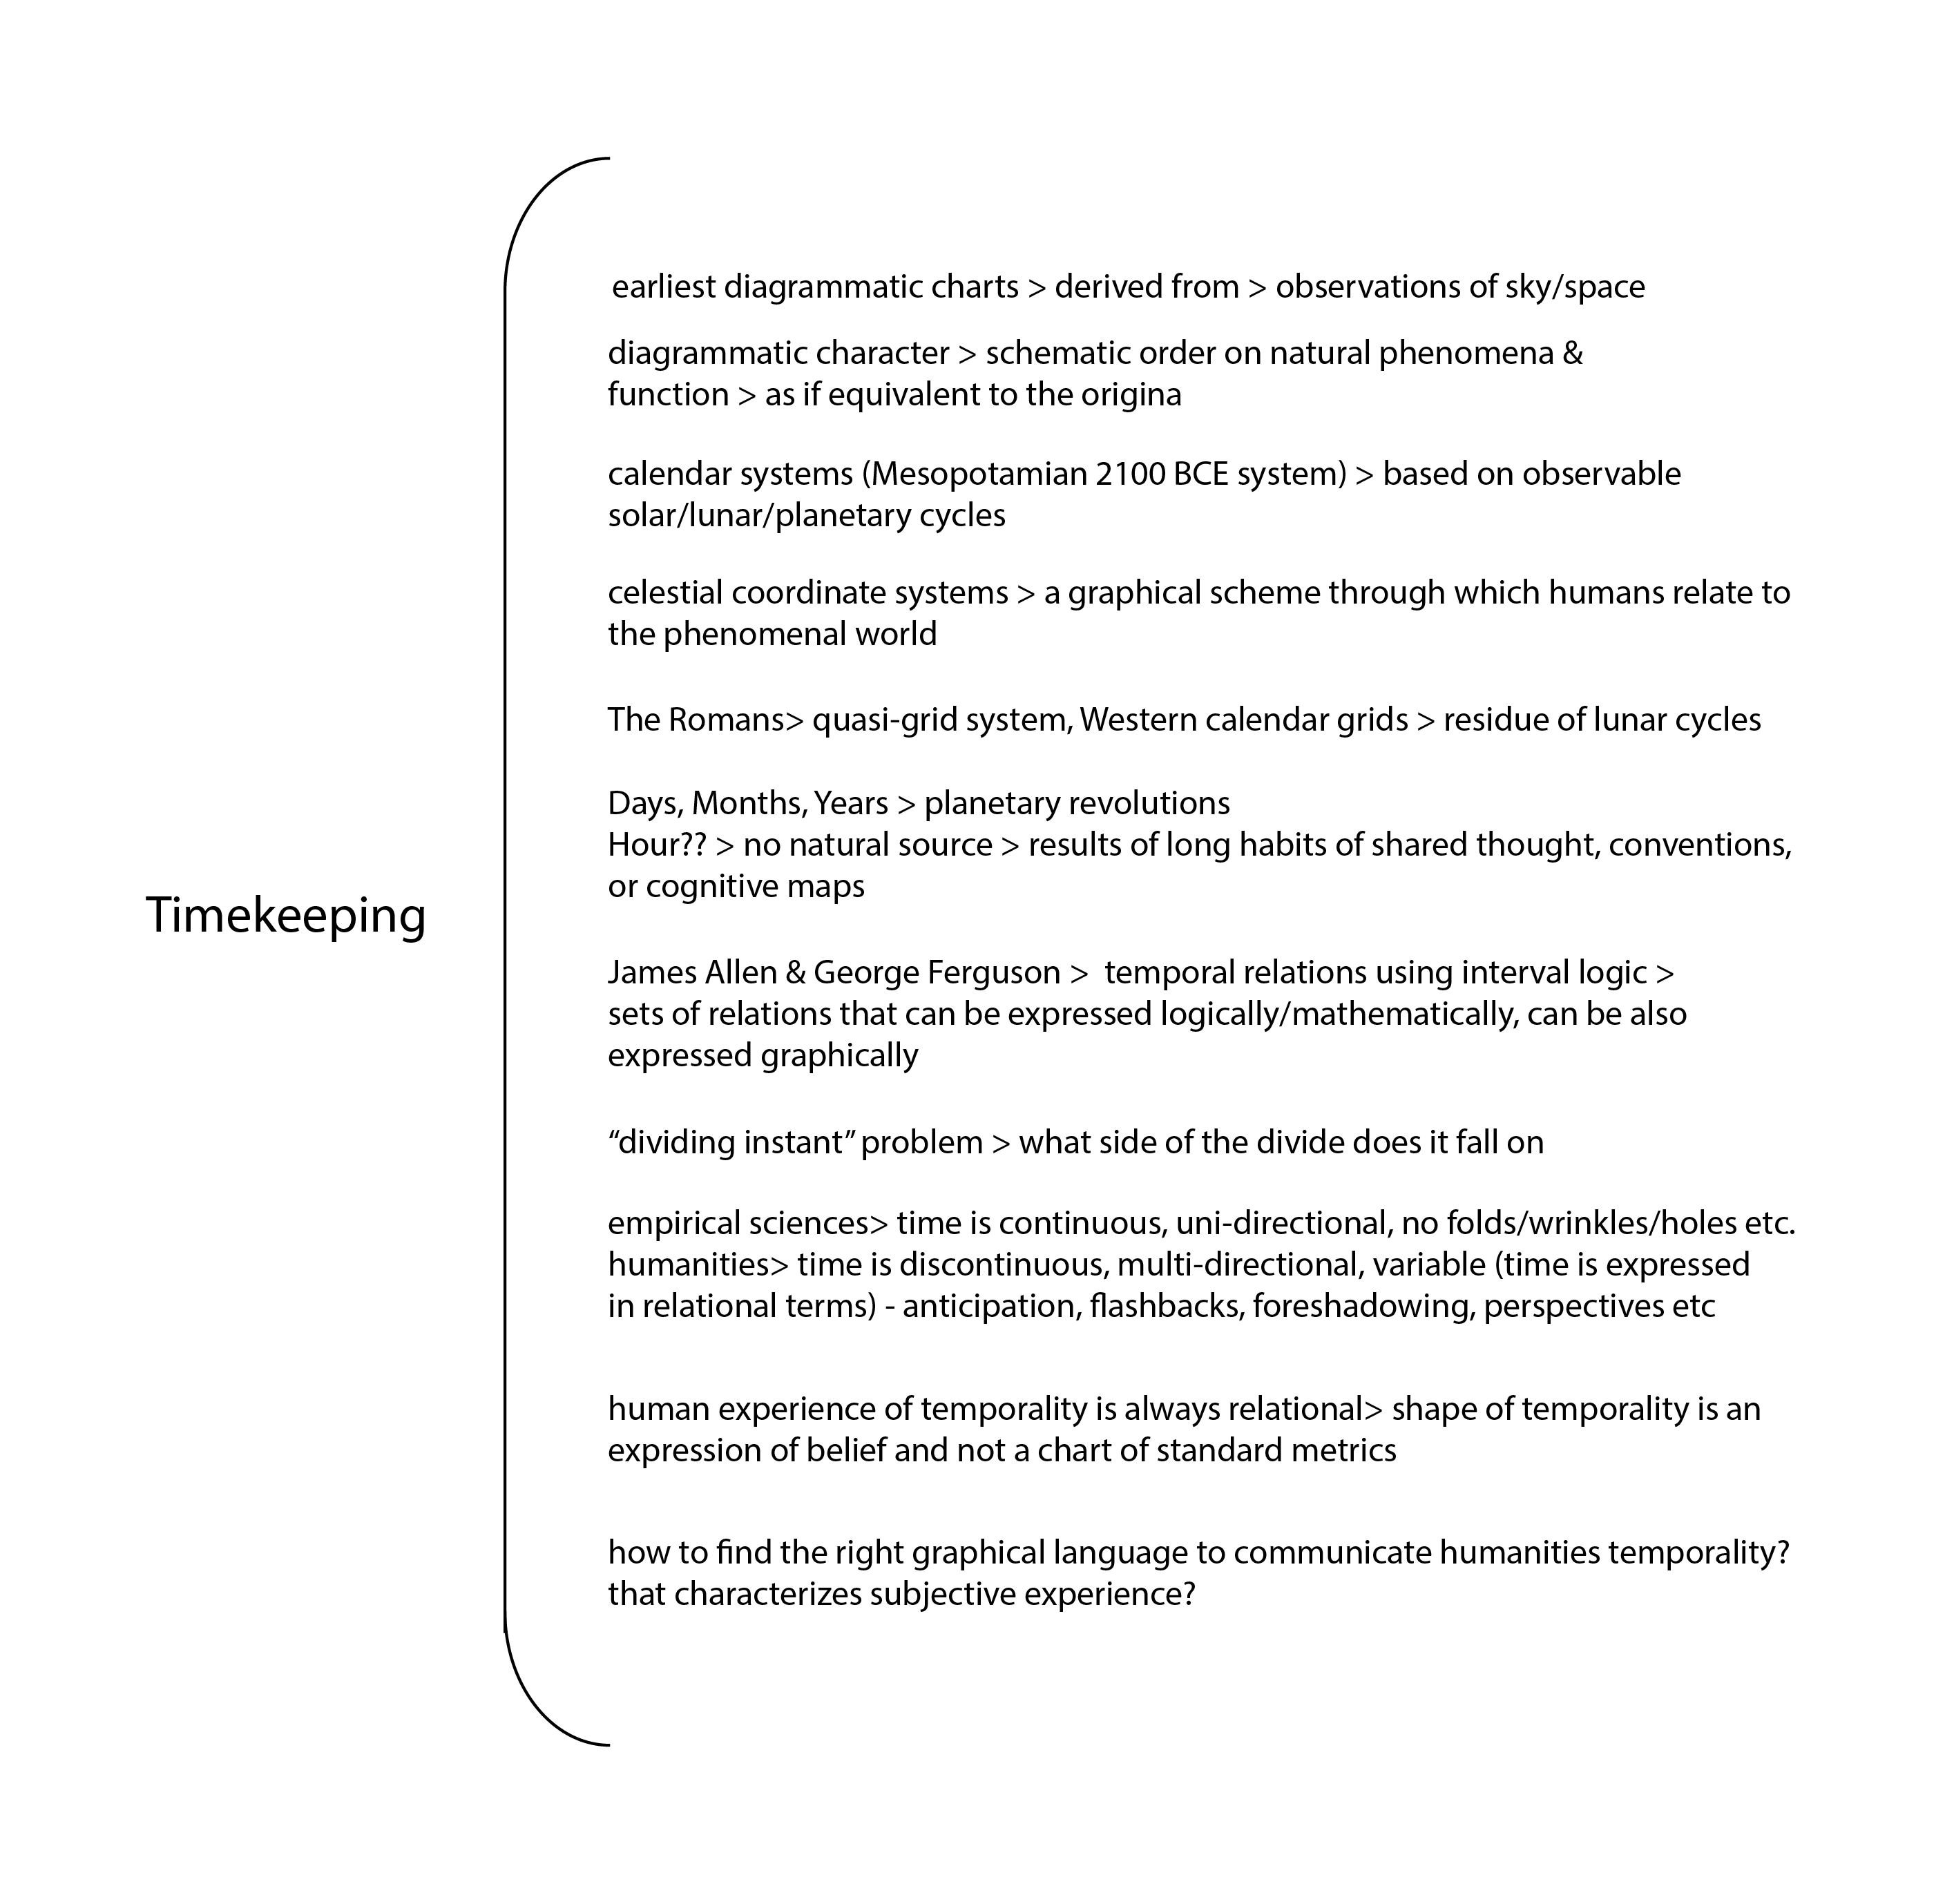
The earliest charts depicting timekeeping derived from observations of the heavens. Those types of charts demonstrate a capacity for abstraction. It imposes a conventional, schematic order on natural phenomena and then functions. Drucker goes on to point out that we are accustomed to understanding the heavens as a set of quadrants and coordinates that we barely register these systems or graphical conventions. The celestial sphere projects a sense of rhythm, order and regularity onto temporal change.
Space-making
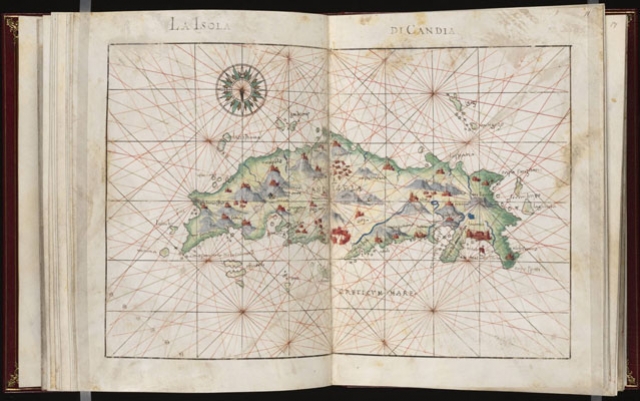
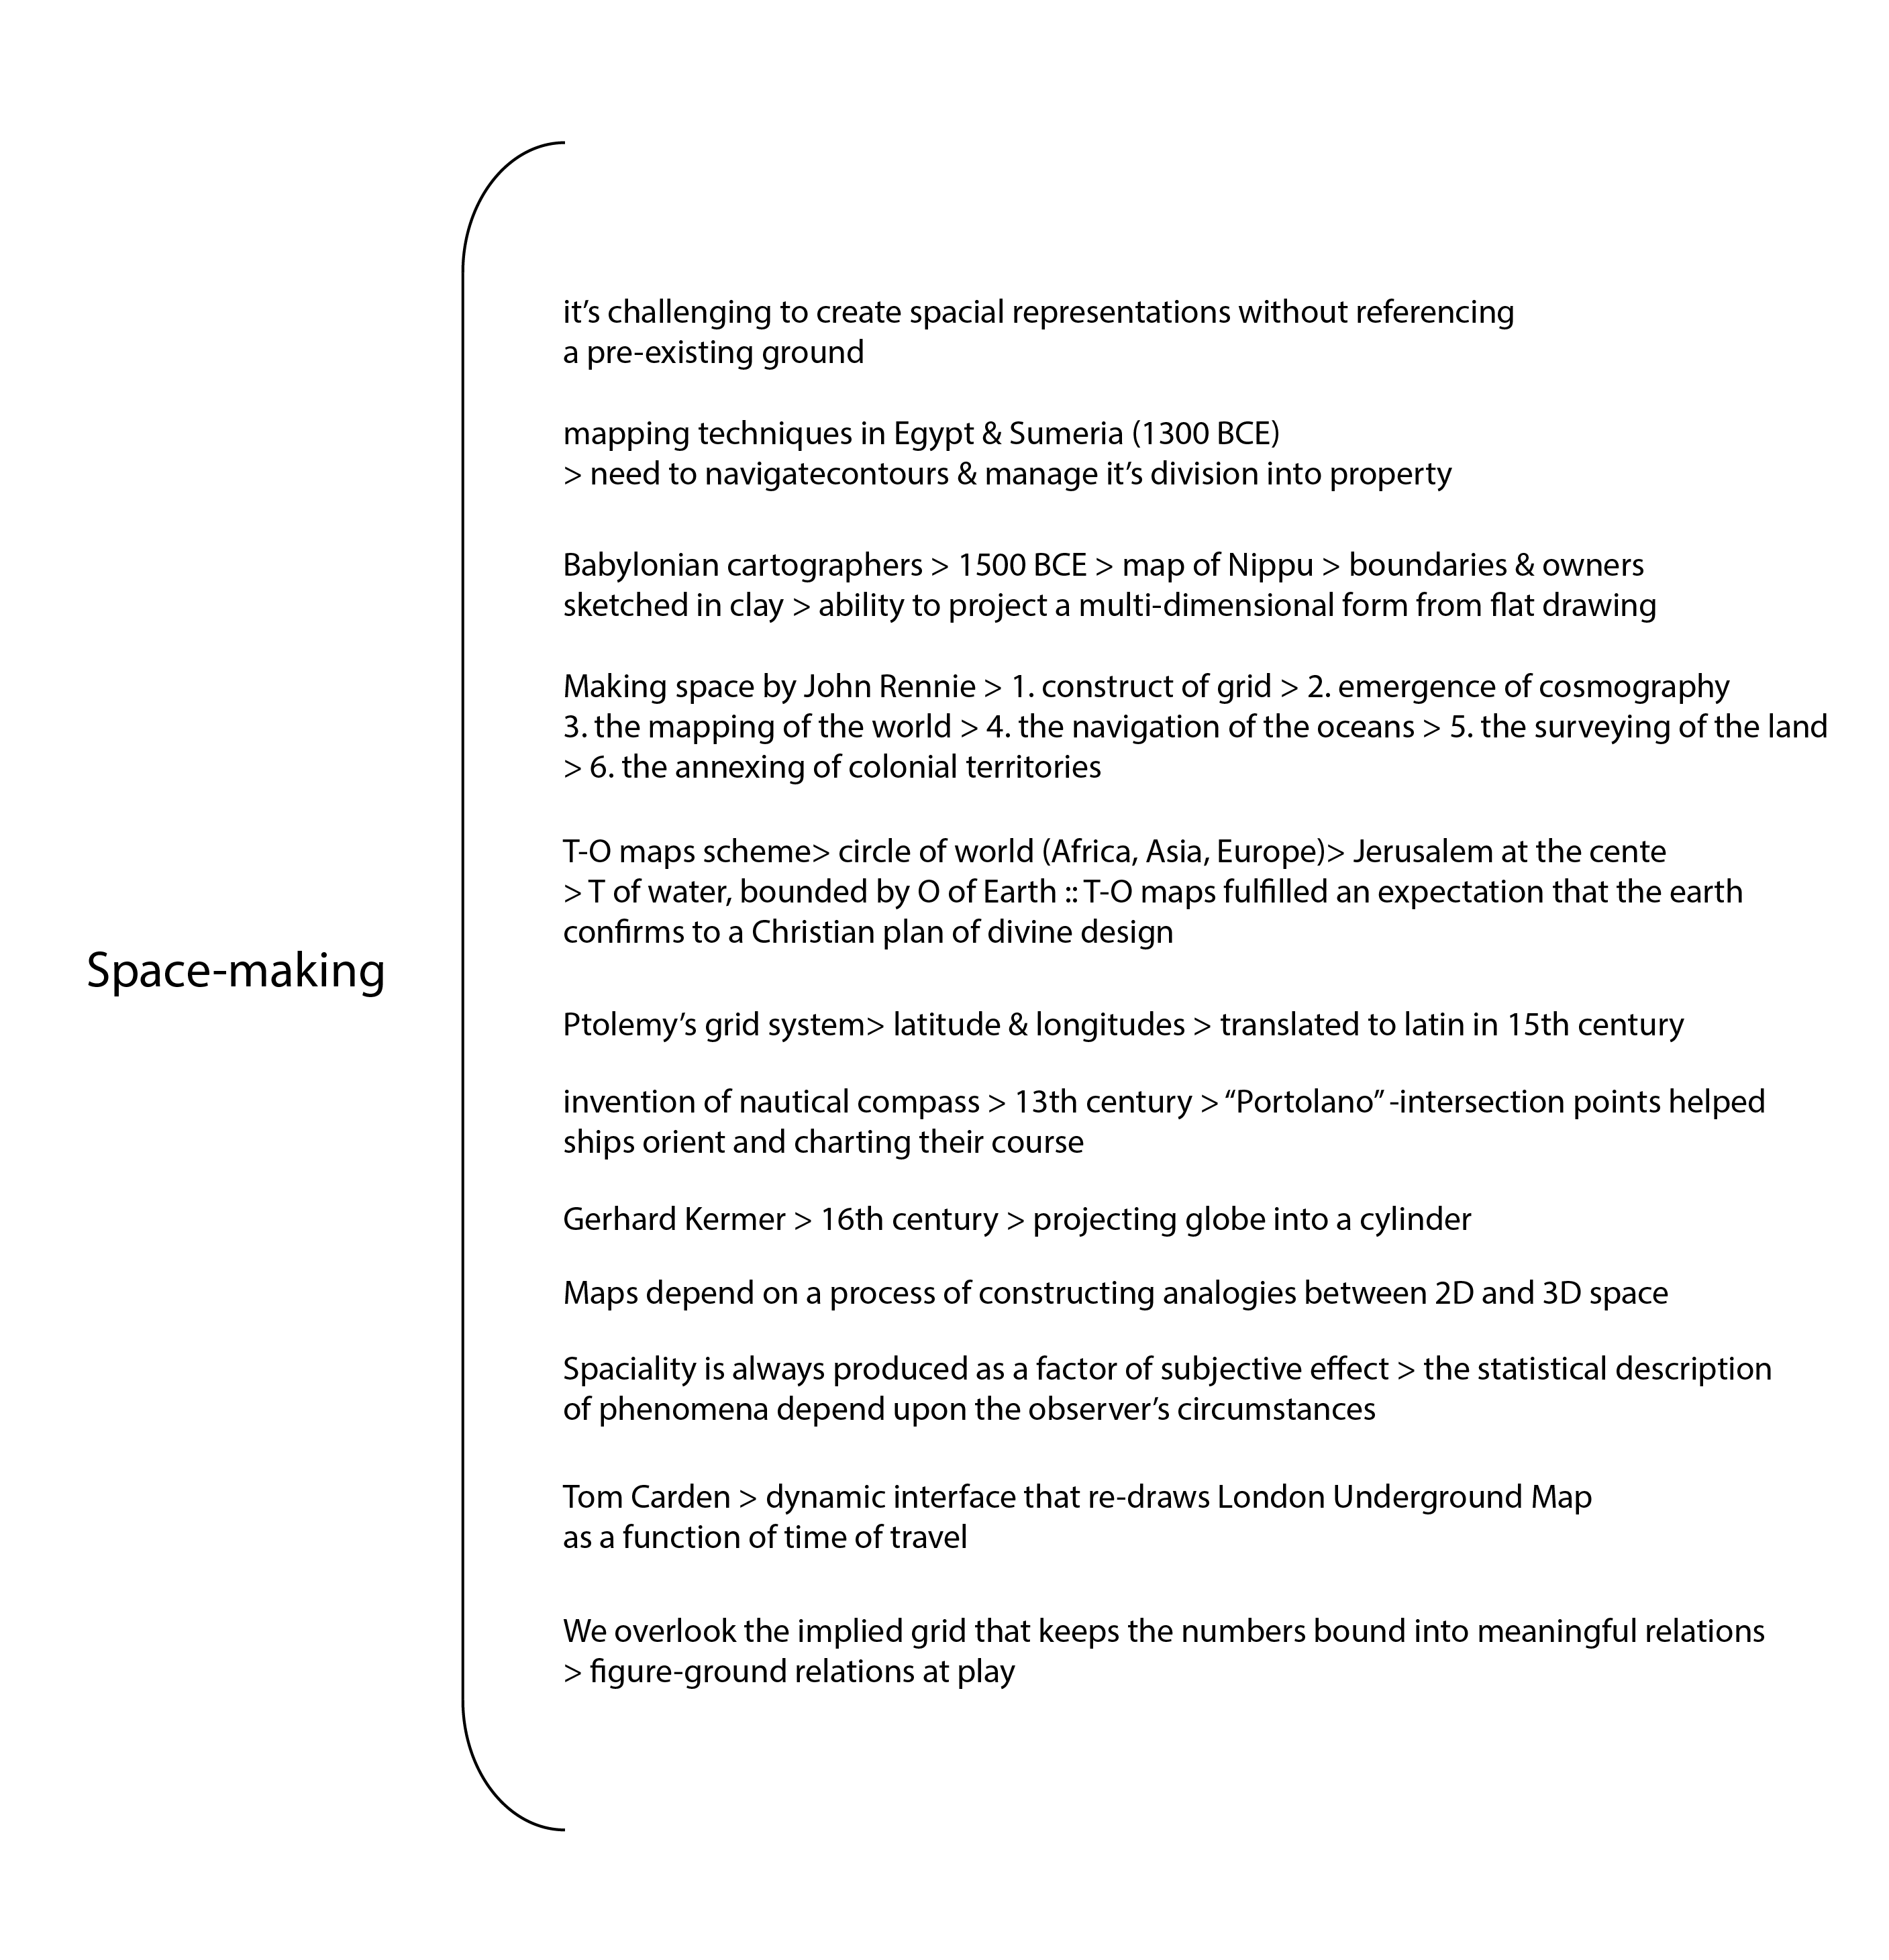
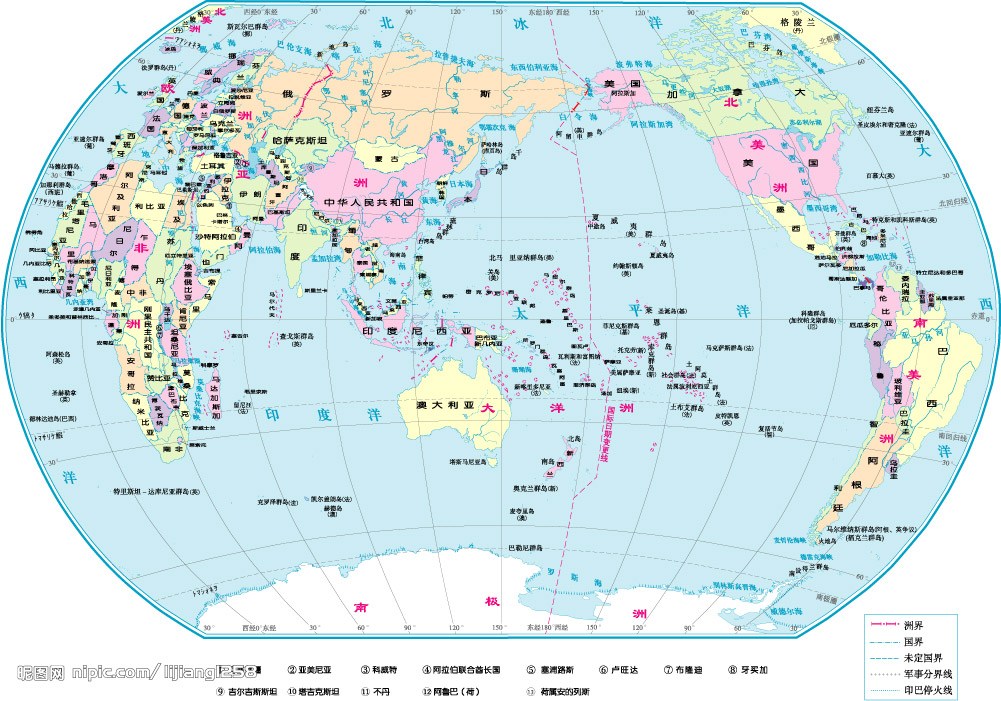
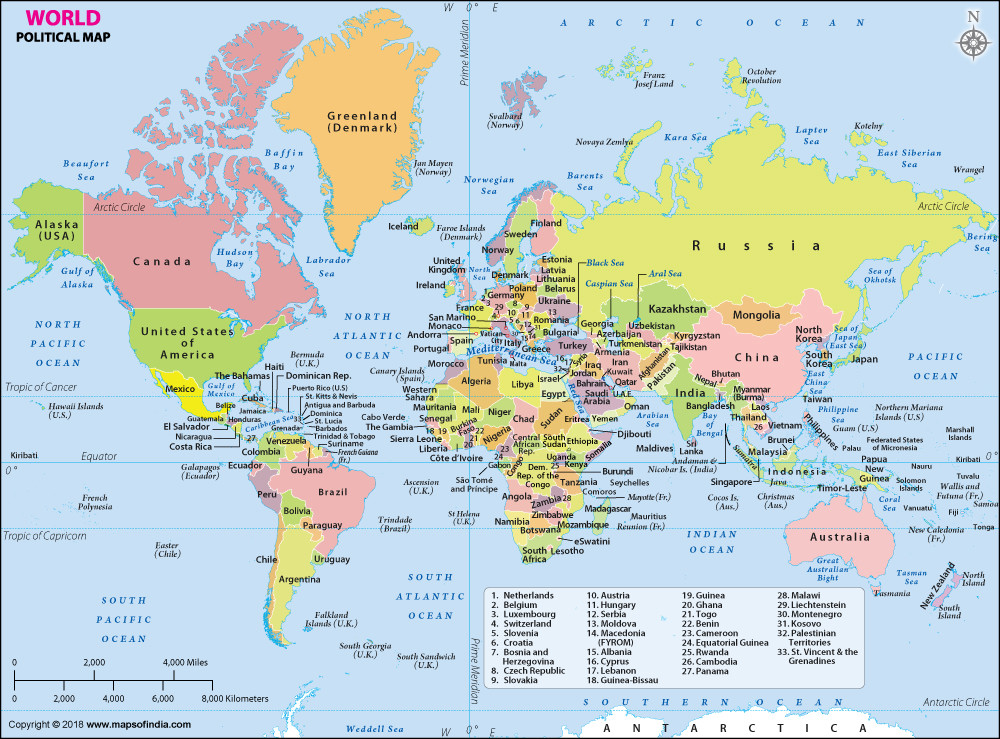
Spatial graphical representation reconciles spatial data and maps of all kinds with a given standard. Drucker points out that the greater intellectual challenge of map visualizations is to create spatial representations without referencing a pre-existing mapping data. Spatiality is always relational, and it's difficult to visualize without having that context. In history, early maps served two main purposes: navigation and way-finding or the identification of ownership and administration of property. Abstracting this type of visualization into a typographic view requires understanding and rationalization of surface and its ordered schemes. According to John Rennie Short, there are six distinct spatial discourses when developing a map visualization including: the emergence of cosmography, the mappings of the world, the navigation of the oceans, the surveying of the land, and the annexing of the colonial territories. Drucker makes a note of noting the importance of the imposition of the schemes. Schemes meant to serve particular purposes, transformed maps from descriptive to instrumental artifacts. I thought it was interesting when she noted that mathematical thinking would not have advanced without spatial techniques.
Record-keeping
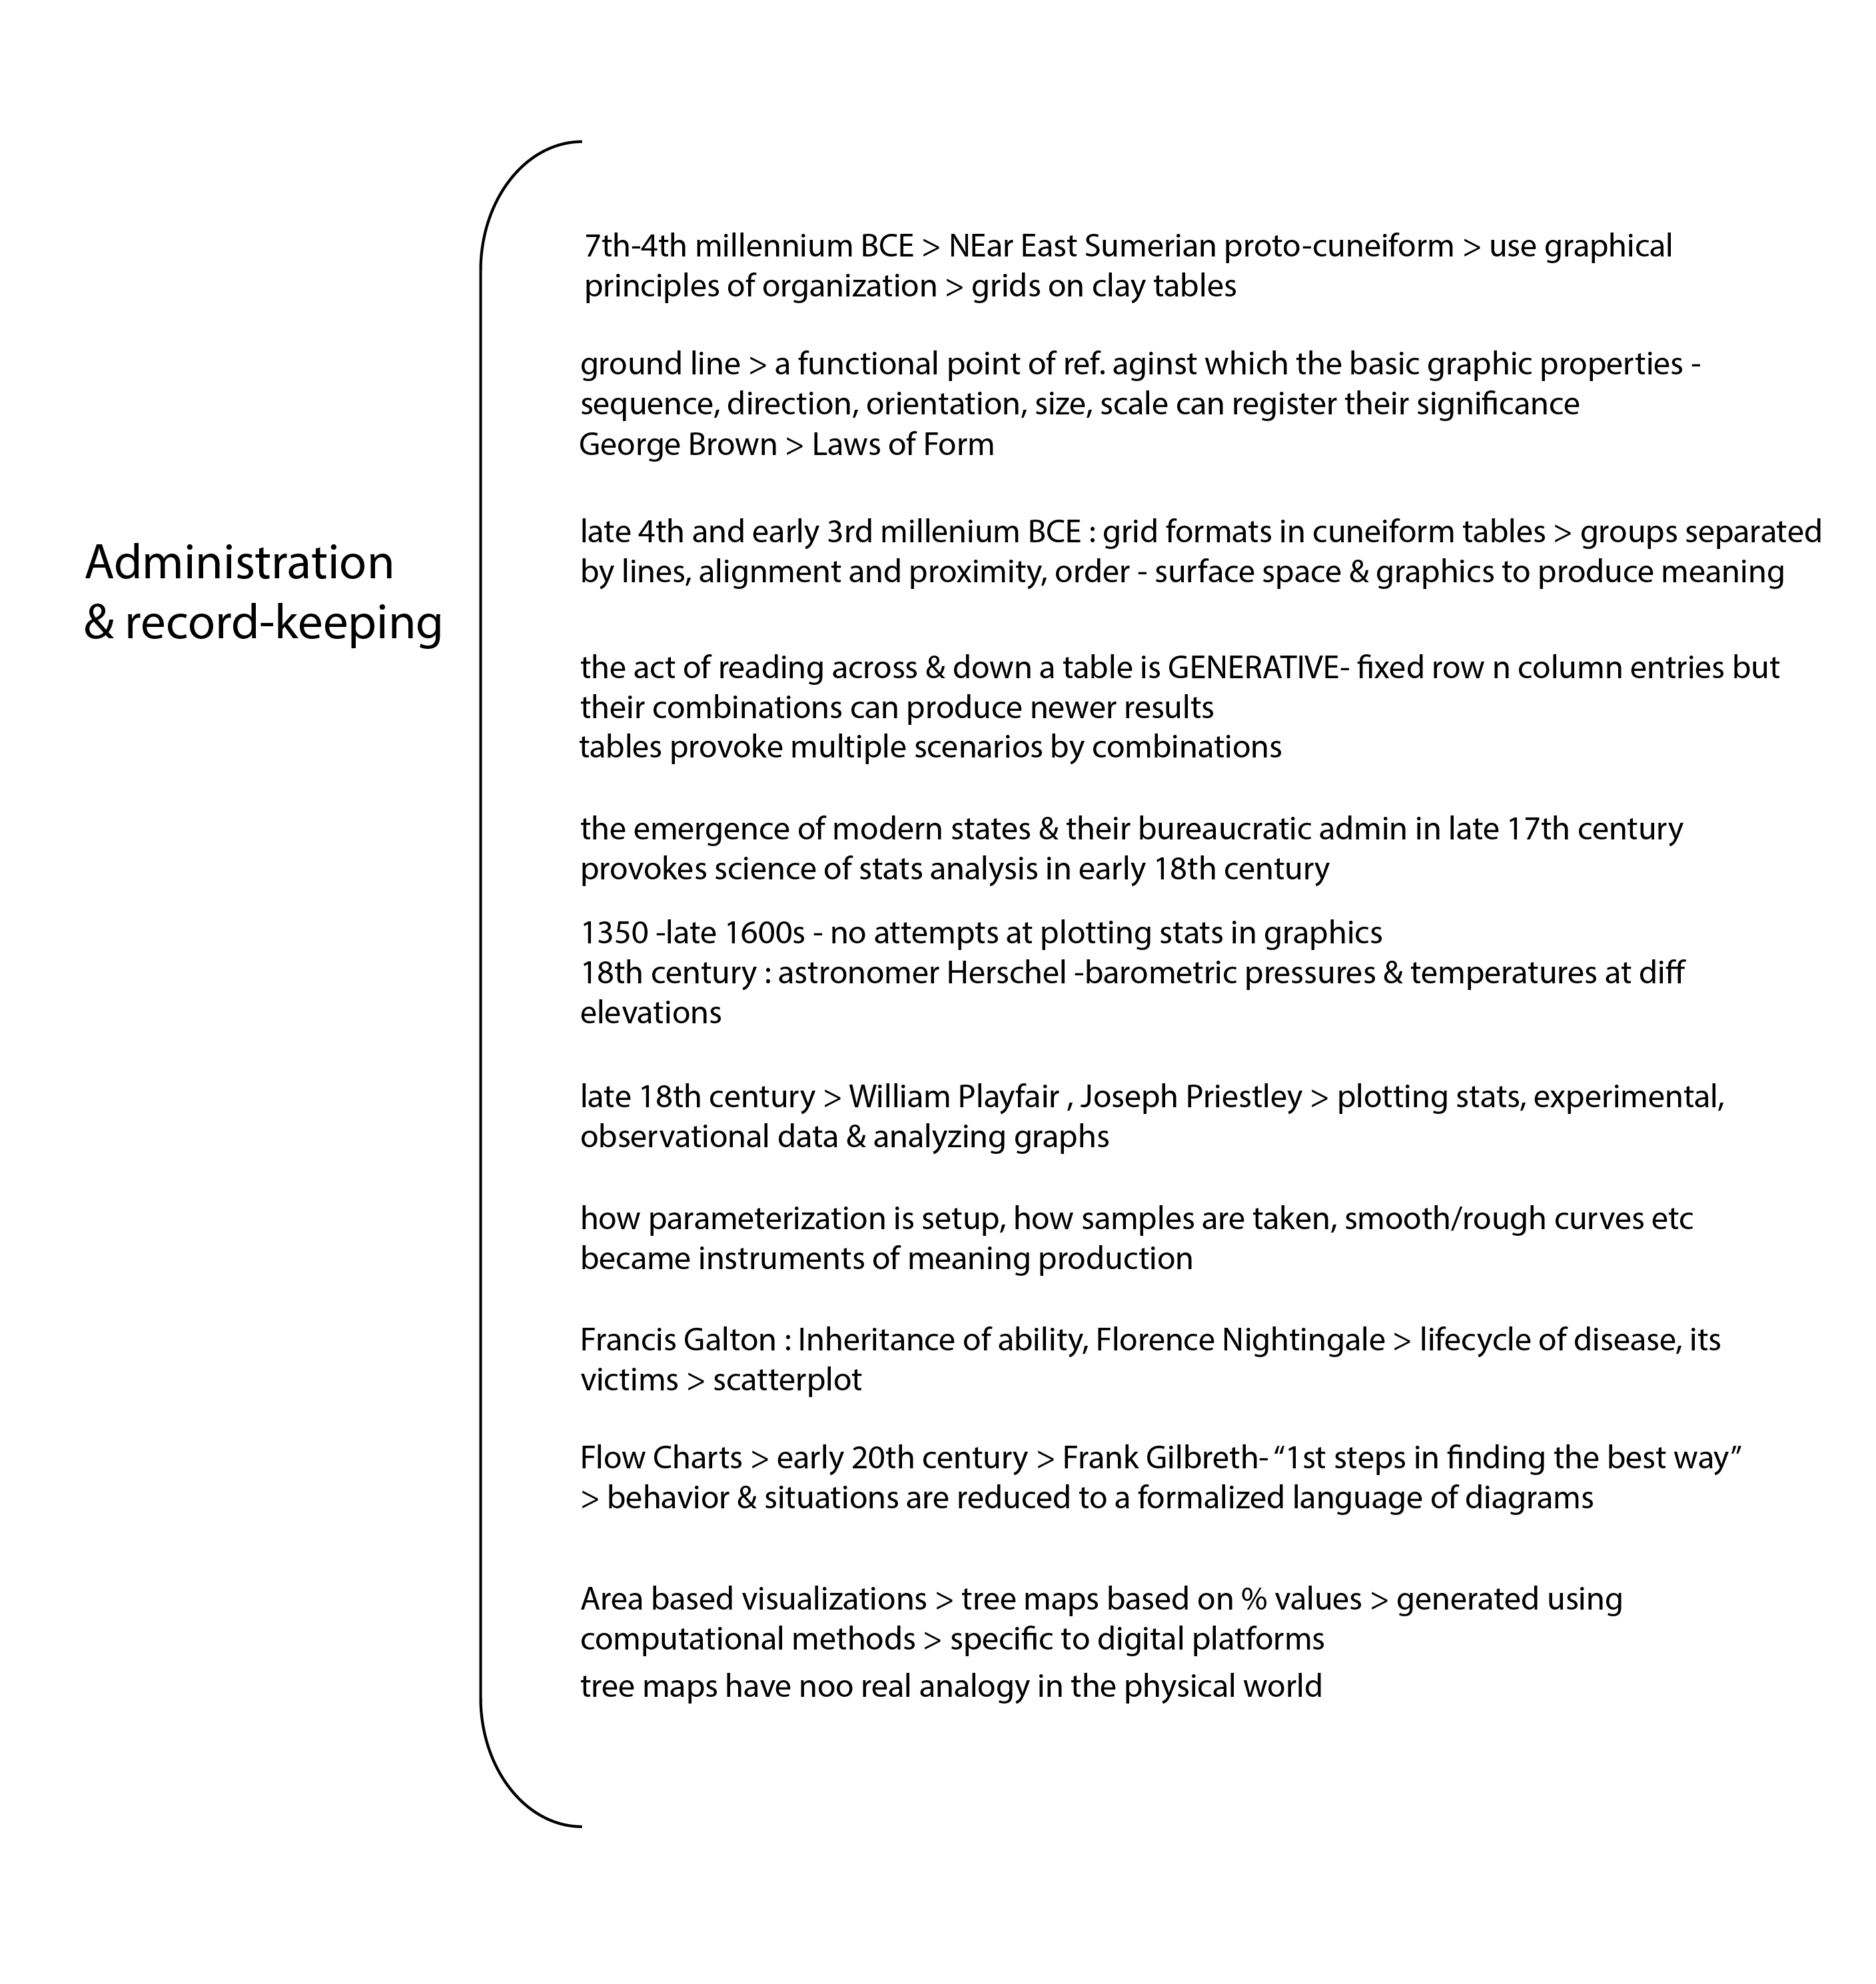
Record-keeping was important to the development of graphical principles. Static arrangement of information in tabular forms were the earliest type of this visualization. There is also the generative act of reading across and down, through the coordinate system to find information. Sequence and order are constituted spatially as well. Statistical graphs and other forms of data display from record-keeping are the intermediate forms between the static format of charts and the dynamic design of knowledge generators.
Trees of Knowledge
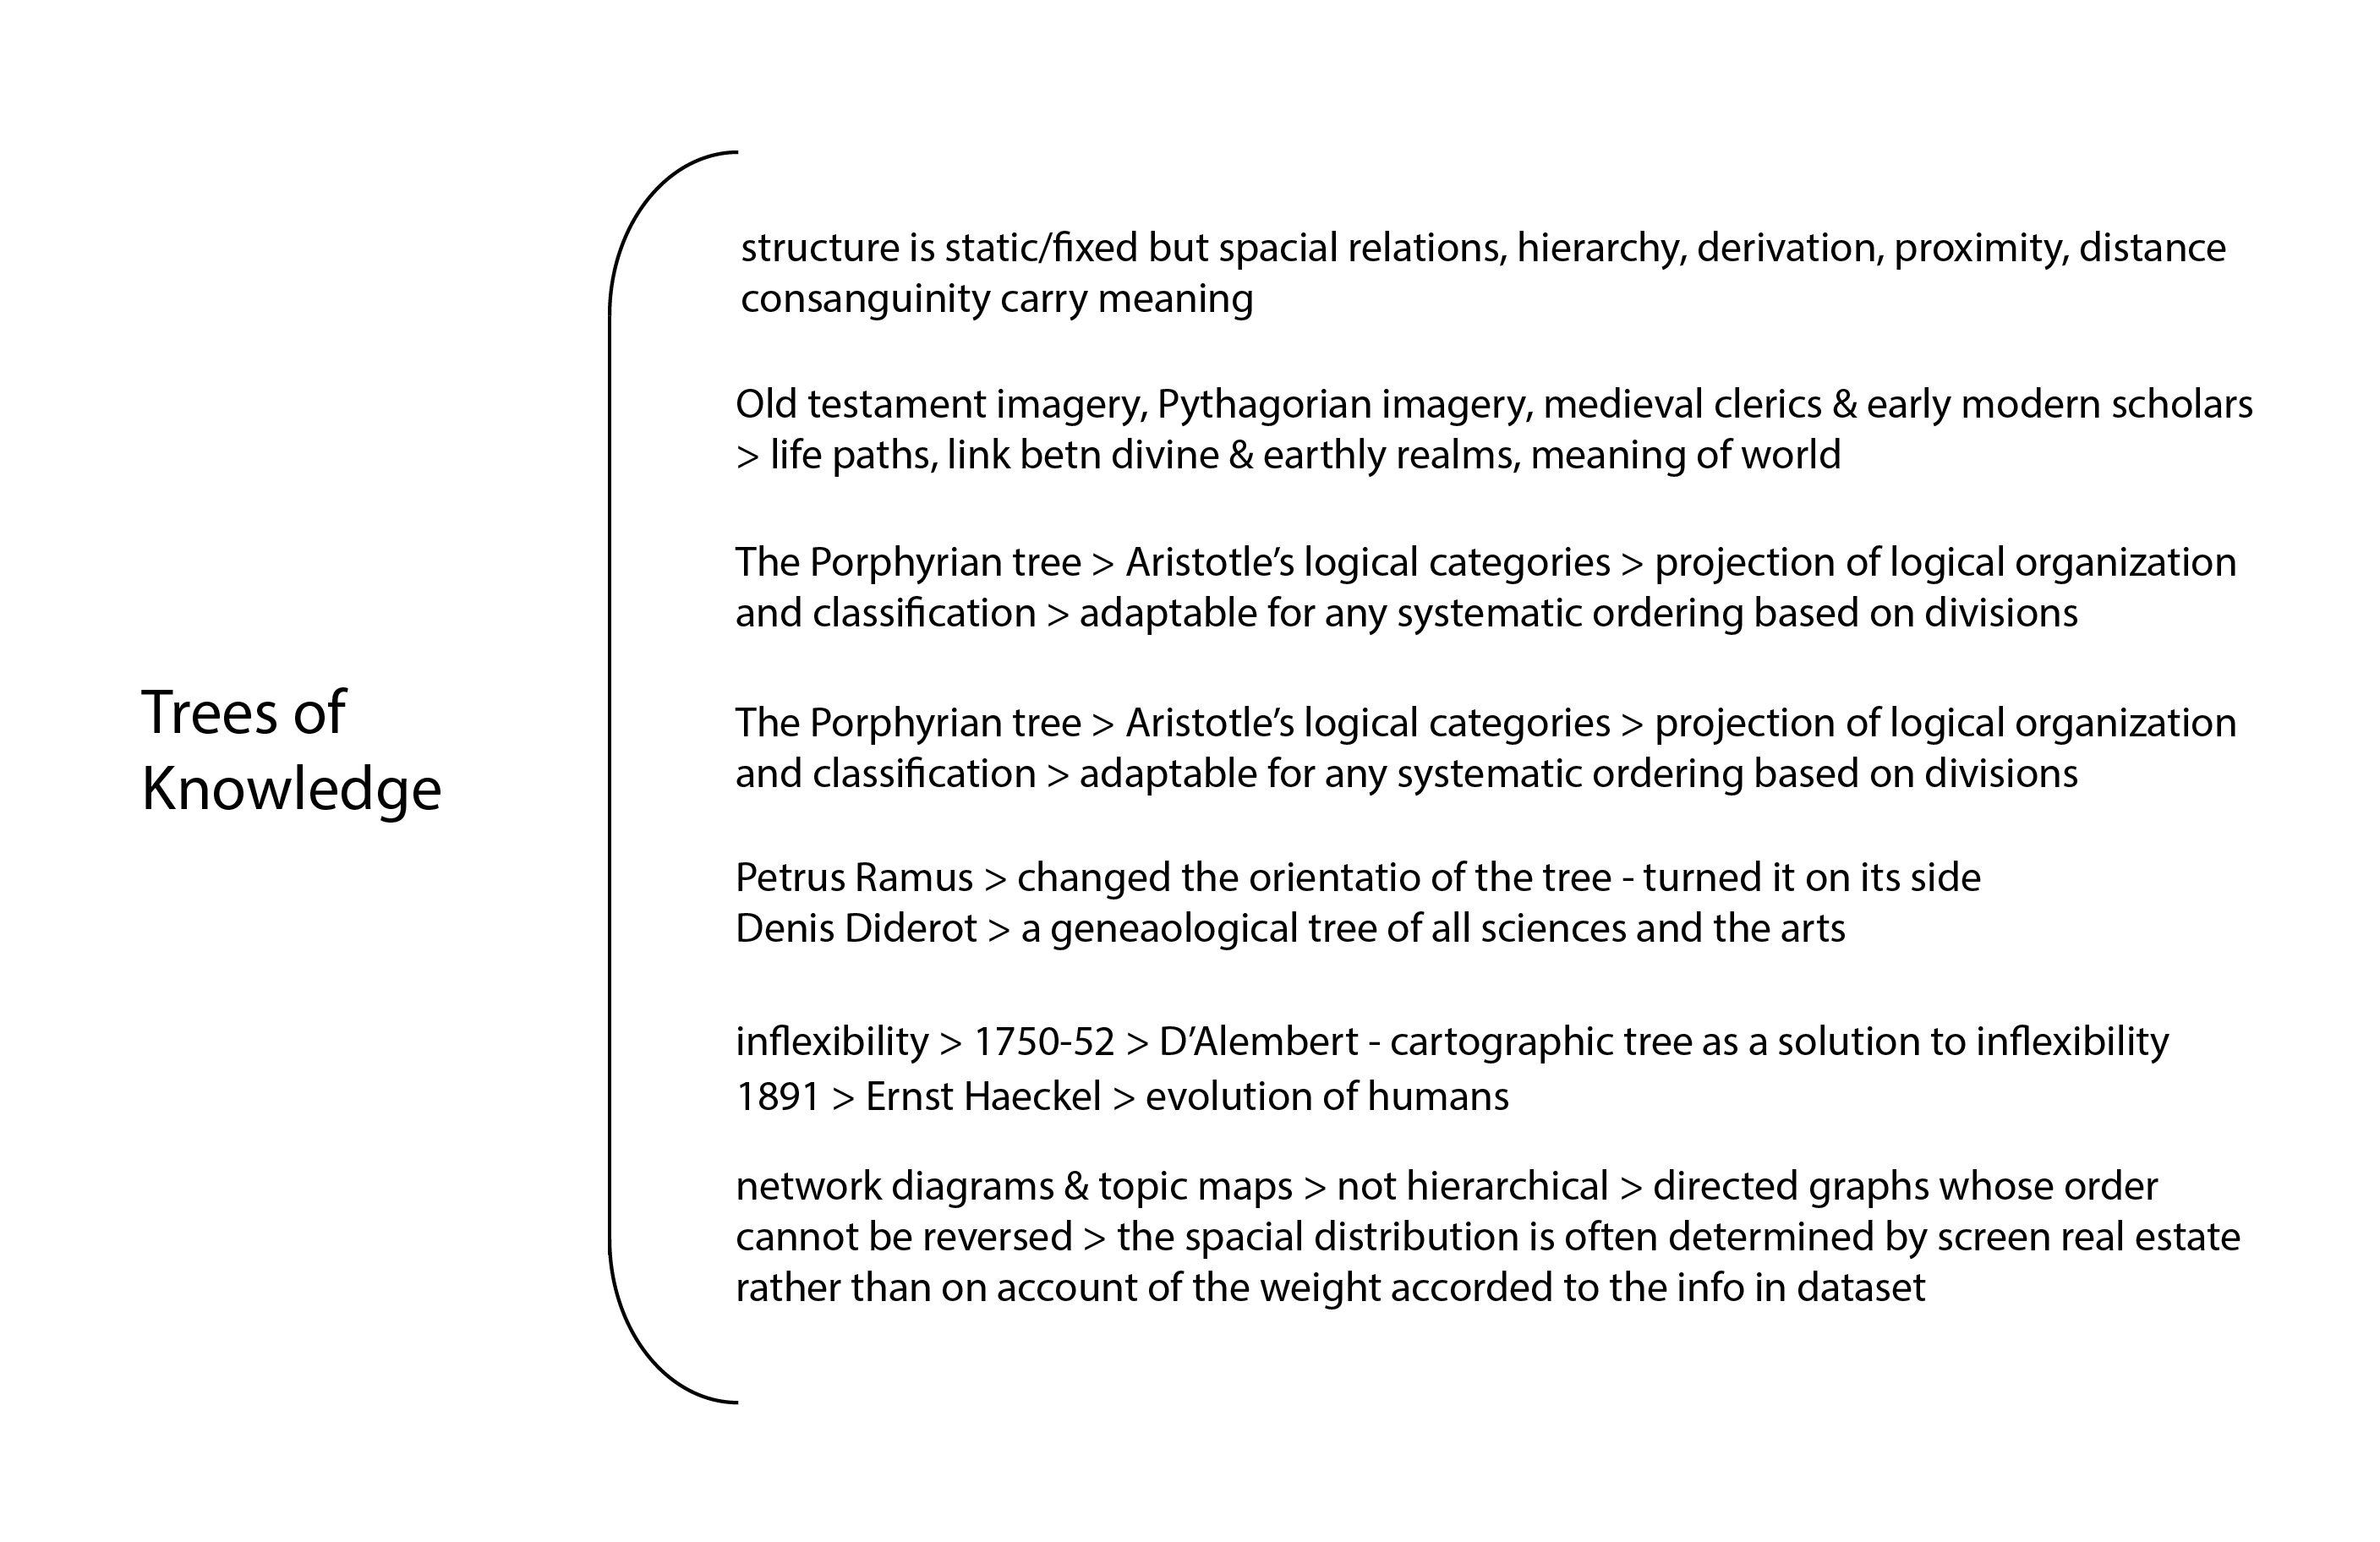
This type of visualization can be described as such: a their structure is static but their spatial relations carry meaning. The nodes and the branches embody value. They can also express relationships. In history, popular use of this type of viz include genealogical trees. Drucker points out that network diagrams and topic maps have many features in common with trees, but they are not hierarchical. It's important to note that Trees of Knowledge almost always express a directed graphs whose order cannot be reversed.
Knowledge generators
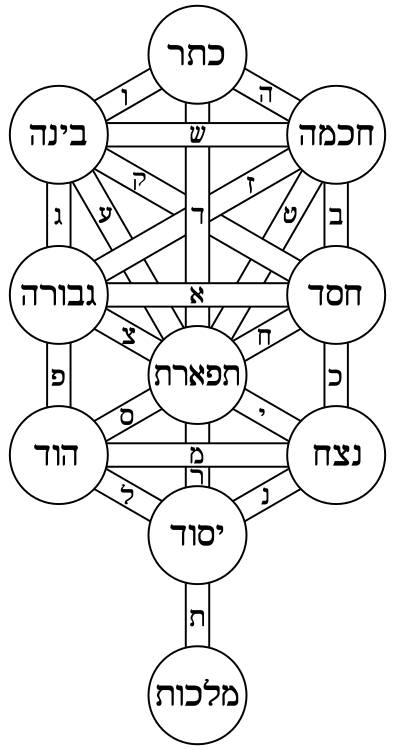
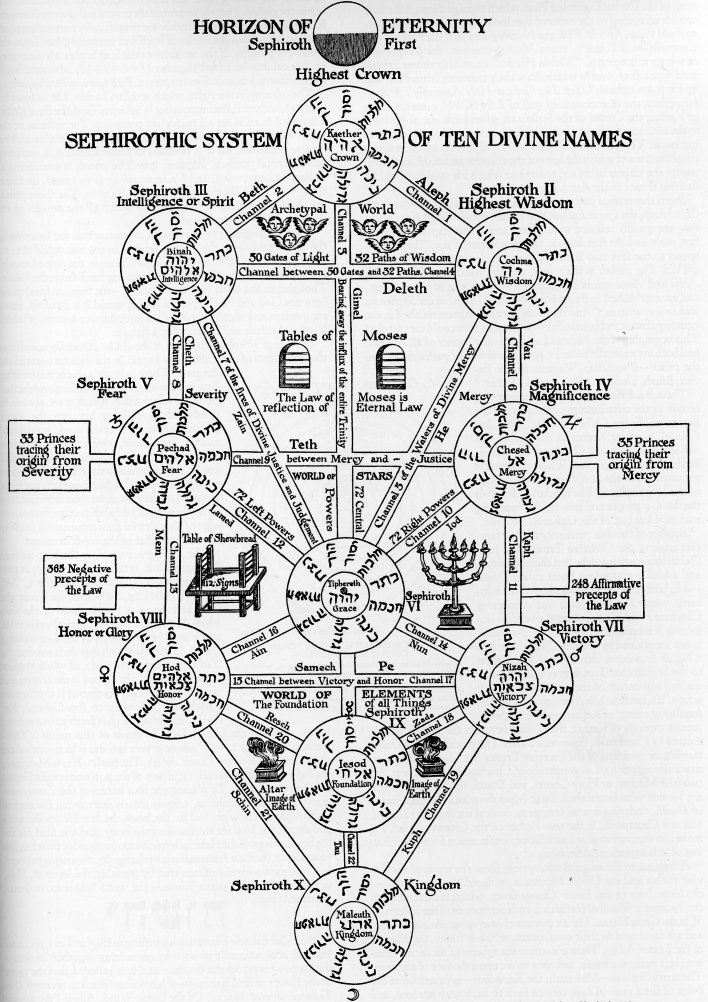
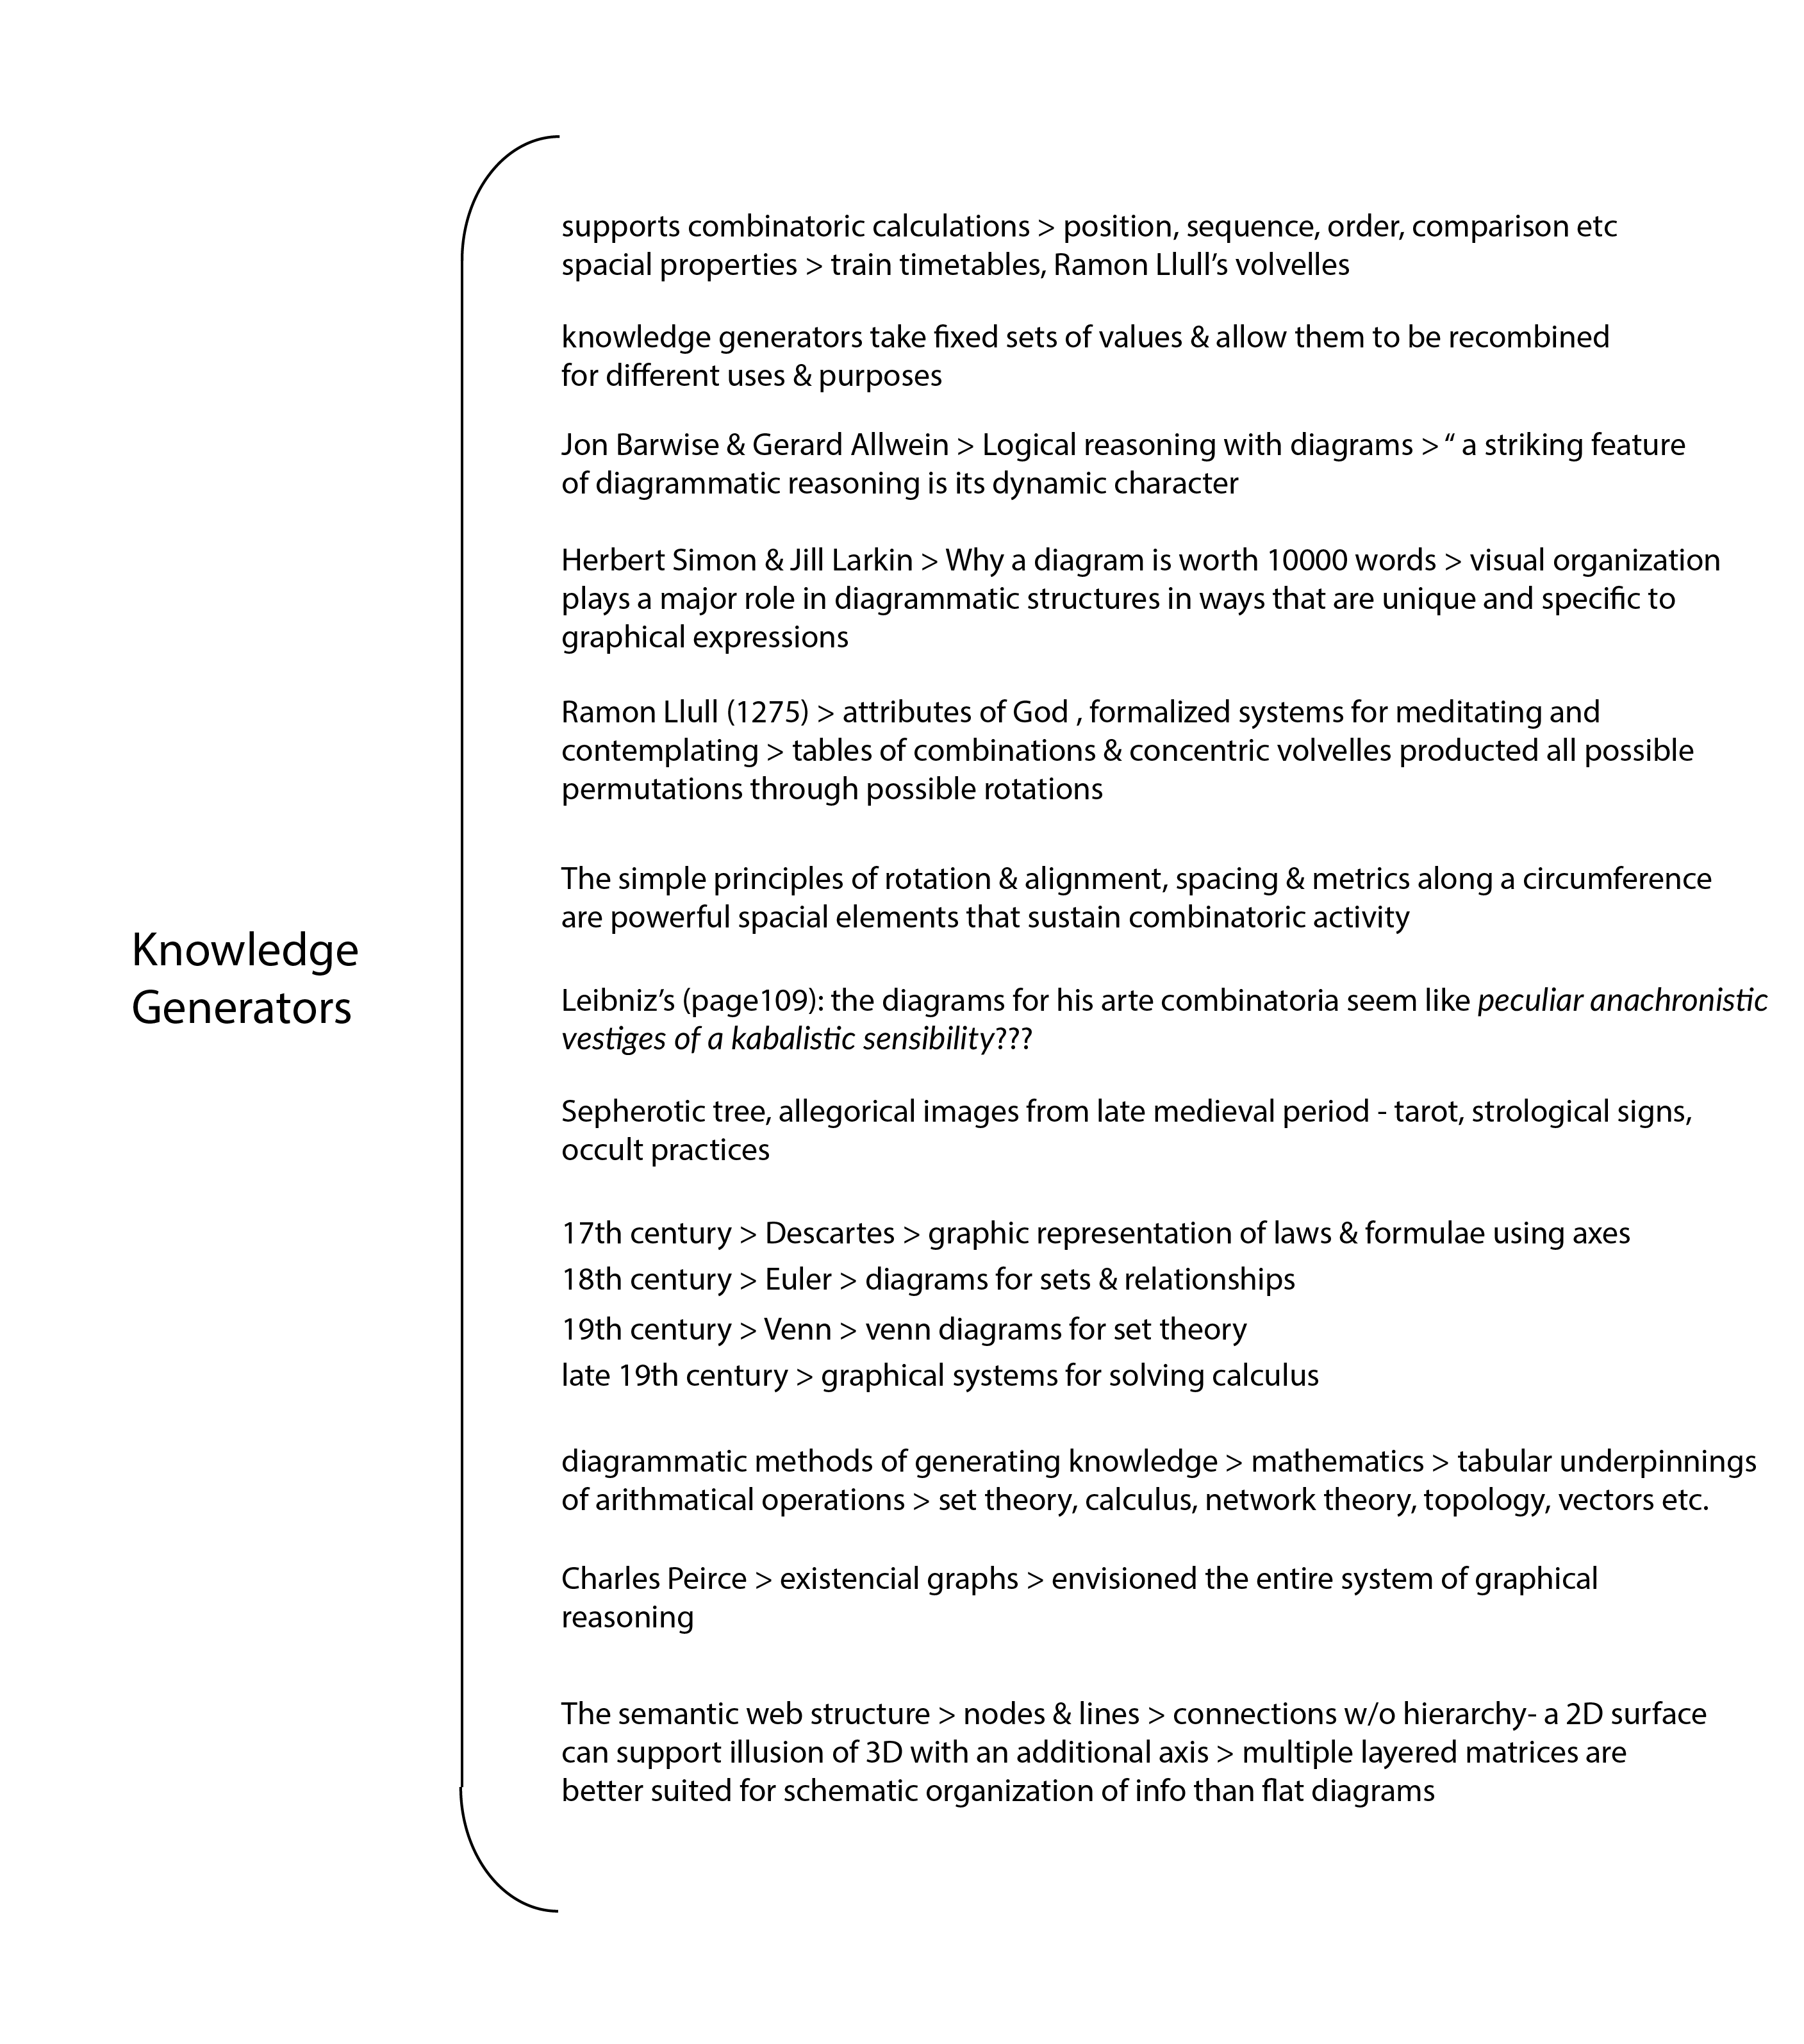
Knowledge generators are graphical forms that support combinatoric calculation. Their spatial organization may be static or mobile but their spatial features allow their components to be combined in a multiplicity of ways. The most interesting part of this section was the look at the Sephirotic Tree from Kabbalah, a set of Jewish mystical practices. The Sephirotic Tree is distinct among other occult practices by vitrue of being diagrammatic - the shape of its organization and the intellectual structure it represents are the same. Its generative potential is spiritual knowledge rather than rational or intellectual insight. The mind must move through its structure to engage with the visualization.
Dynamic systems
Diagrams of dynamic events use dynamic elements such as vectors, or directed graph lines, direction, flow, movement and rates of change as components whose spatial order creates a graphical field. Diagrams of dynamic processes are different from knowledge generators as they are not meant to produce an outcome that can be repeated.
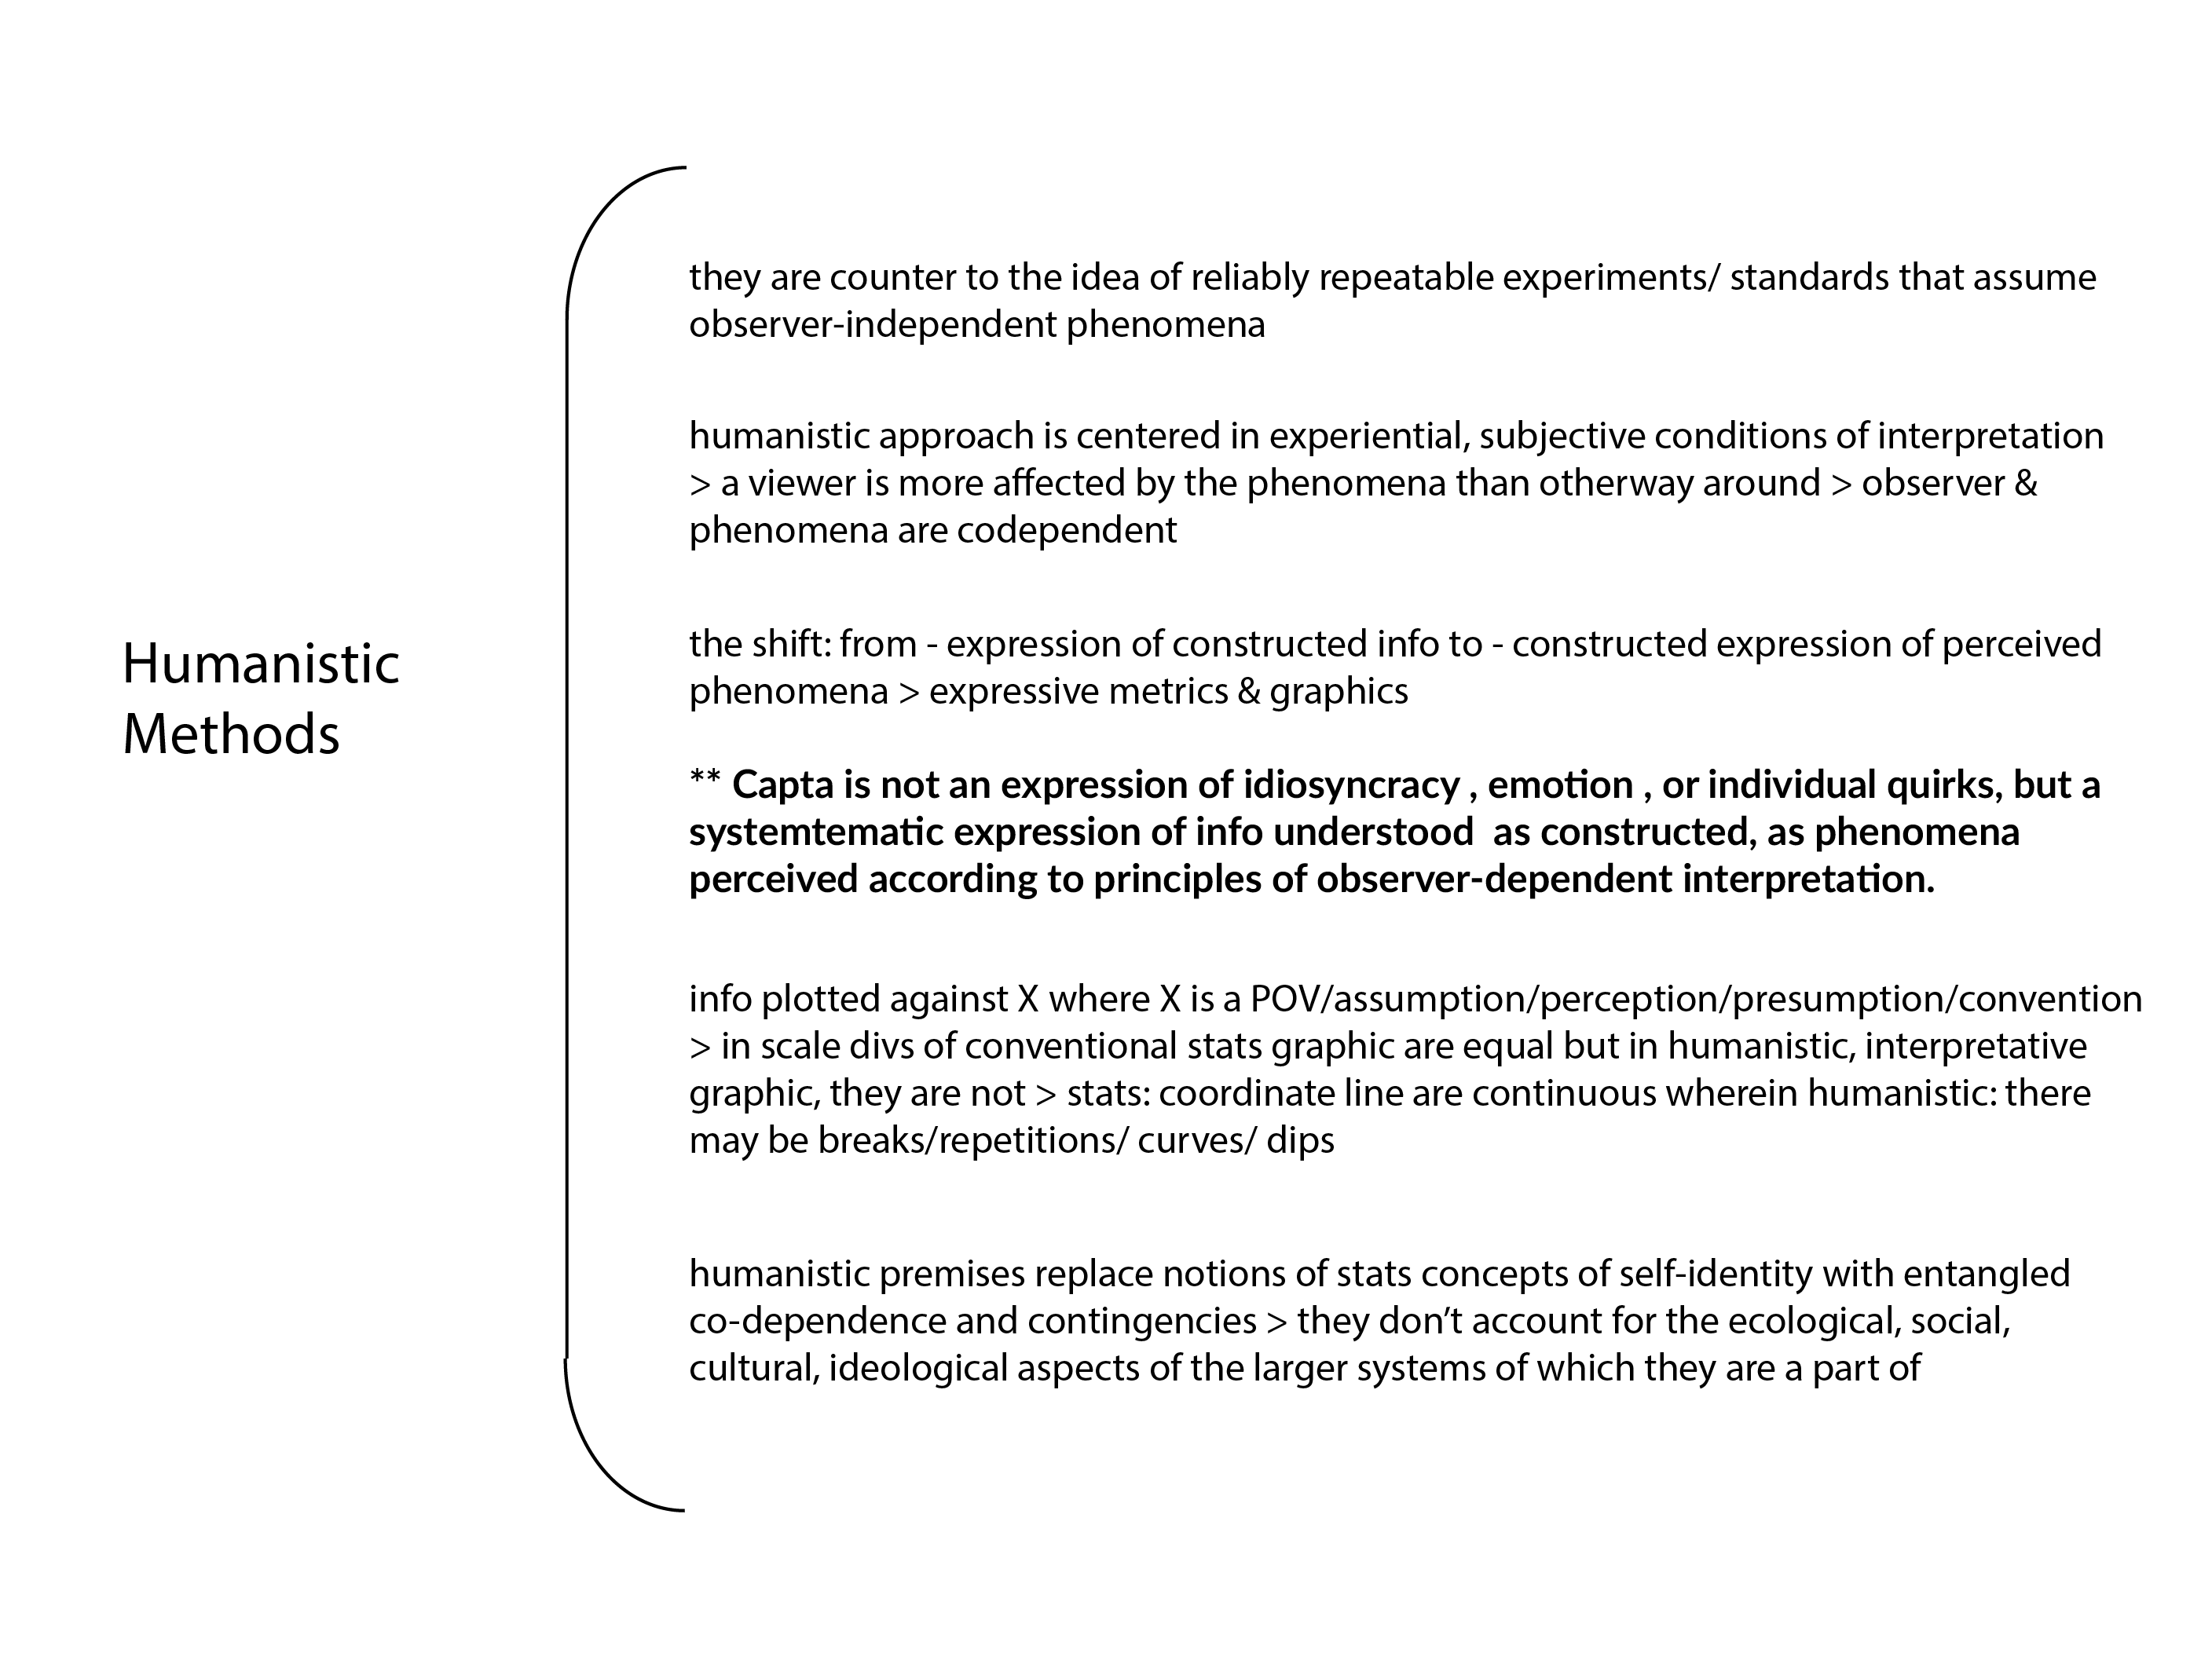
Humanistic methods
Drucker defines humanistic methods in visualizations as counter to the idea of reliably repeatable experiments and is more so focused on the experiential, subjective conditions of interpretation. The shift away from standard metrics to metrics that express interpretation is an essential move for humanists - to look at the perceived phenomena instead. Interpretation is stochastic and probabilistic in nature, not mechanistic and its uncertainties require the same mathematical and computational models as other complex systems. I am quite partial to this way of interpreting information and really enjoy Giorgia Lupi's work, who is a modern day believer in humanistic approaches in her visualizations.
Visualizing interpretation
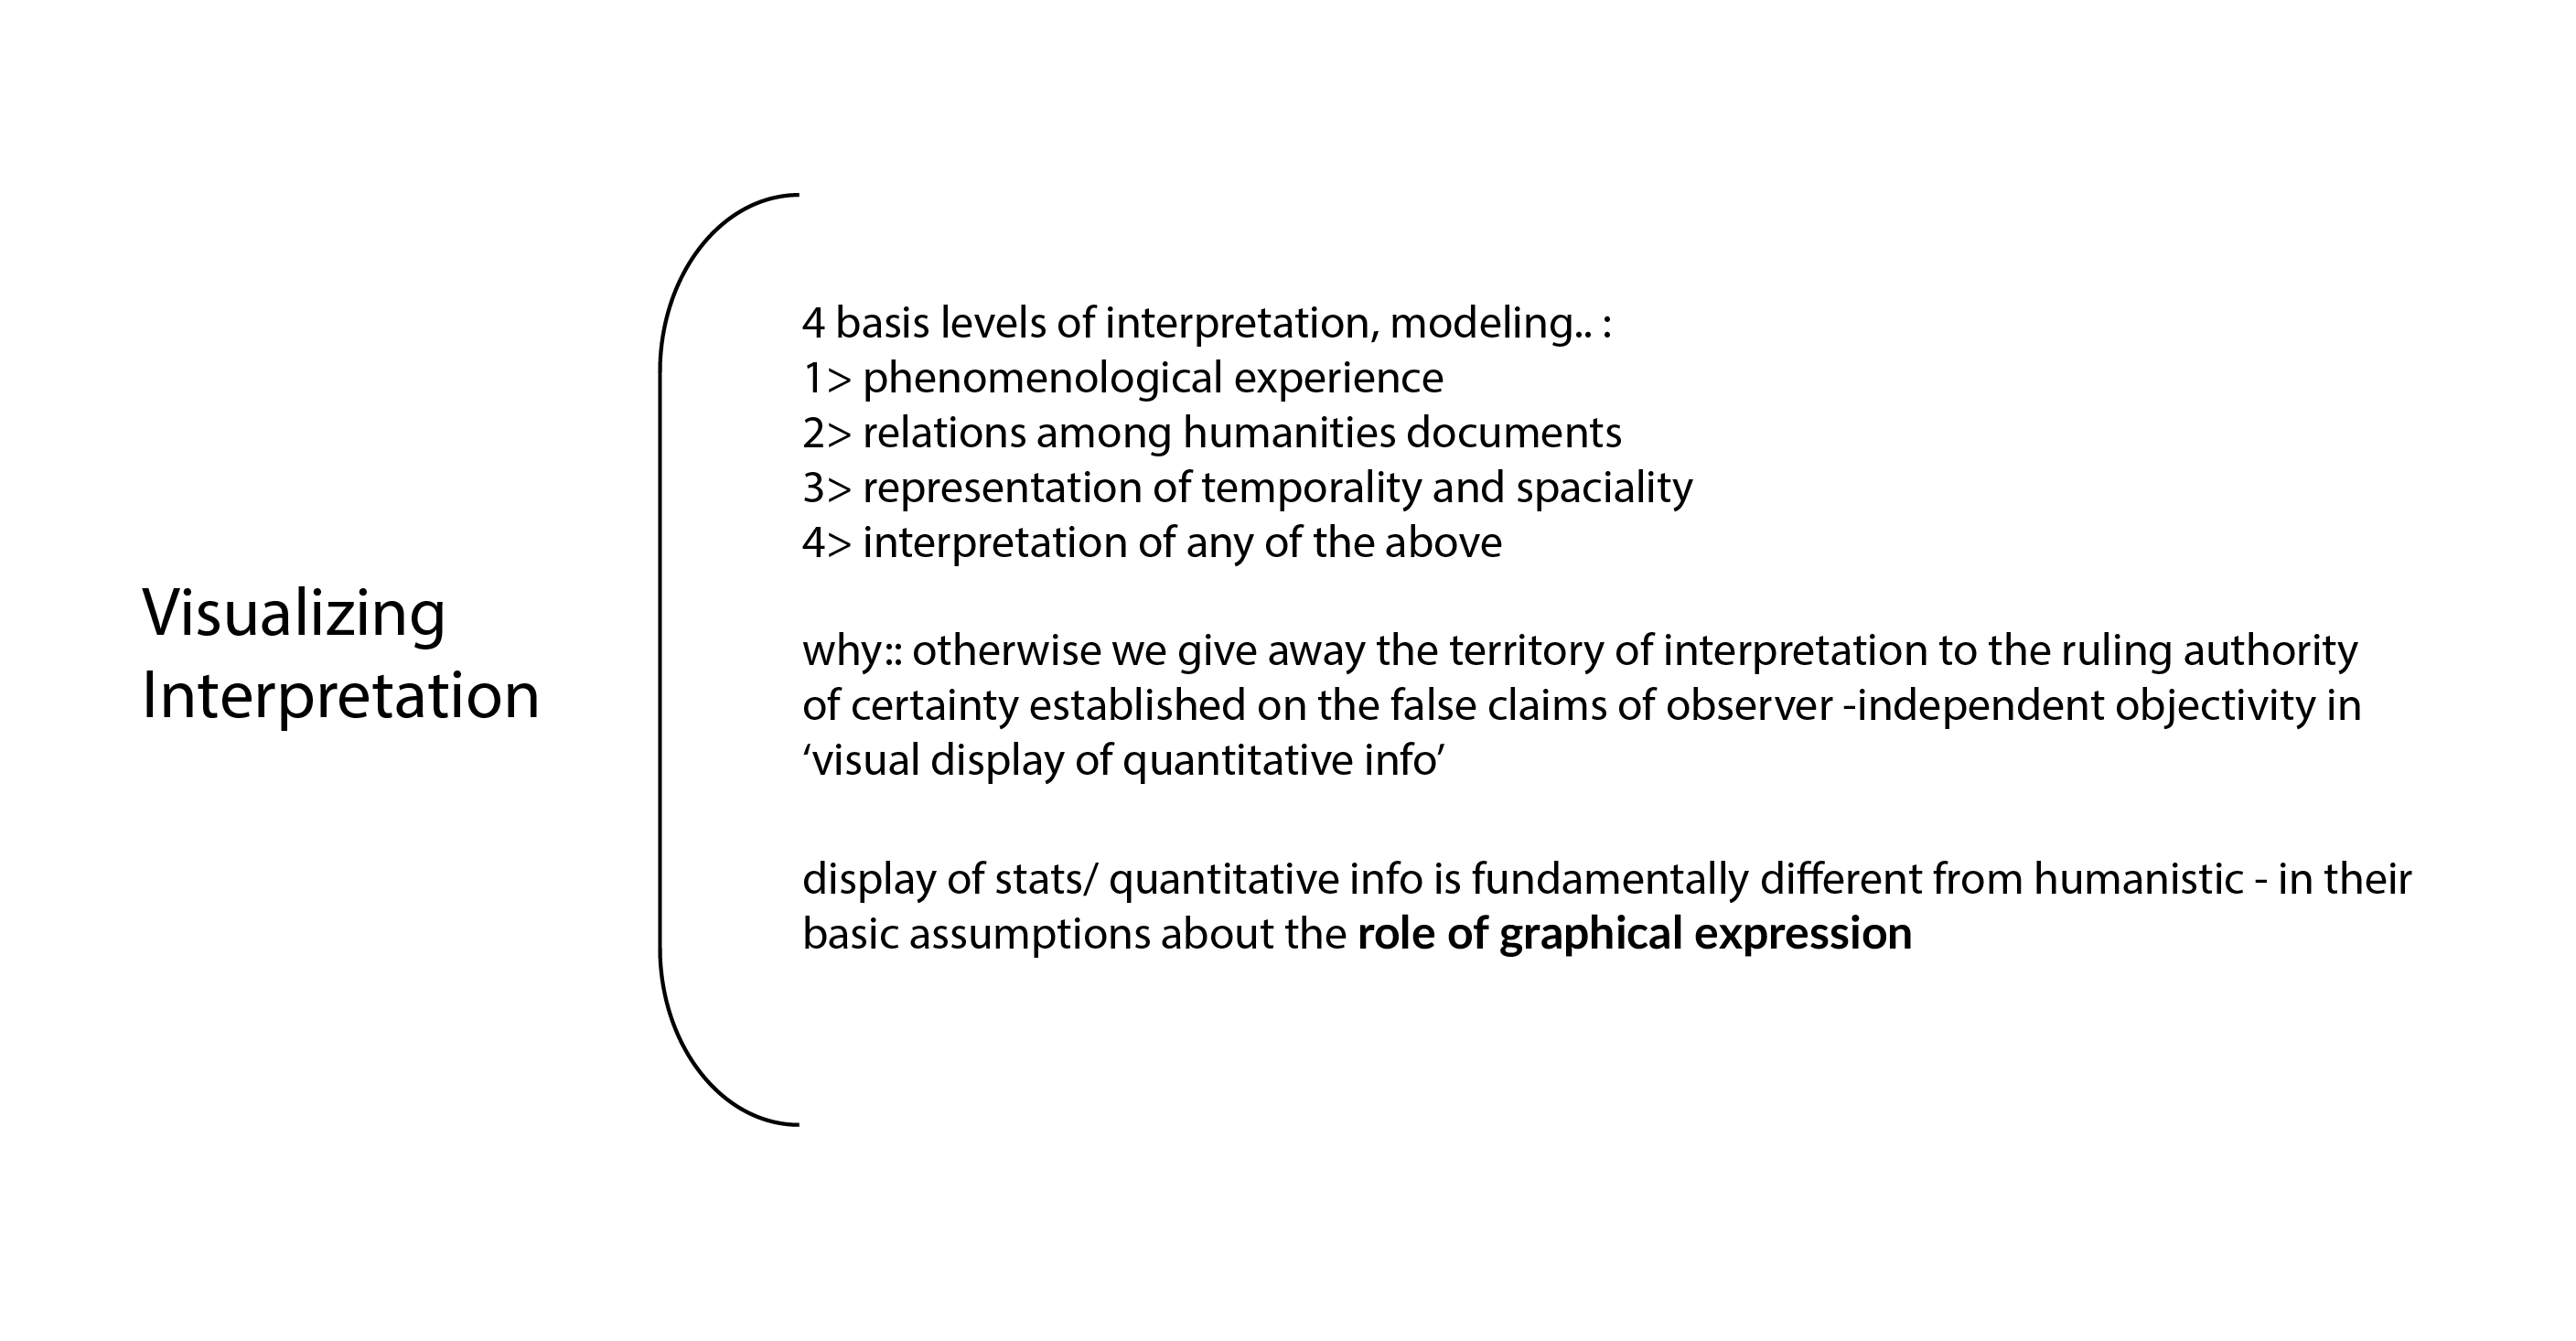
Drucker suggests four basic levels of interpretation of knowledge production with a humanistic element:
1) Modelling phenomenological experience in the making of humanities
2) Modelling relations among humanities documents.
3) Modelling the representations of temporality and spatiality that are found in humanities documents
4) Modelling the interpretation of any of the above.
Points of discussion
Sources
Drucker, Johanna. Graphesis: Visual Forms of Knowledge Production
This chapter focuses on the histories and analytic principals for nine traditional lineages in visualization and information graphics as follows: timekeeping, space-making, administration and record-keeping, knowledge trees, knowledge generators, dynamic systems, visualizing uncertainty and interpretive cartography, and humanistic methods.
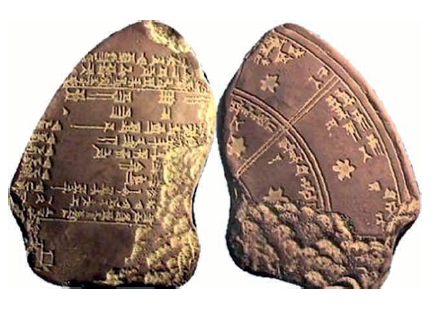
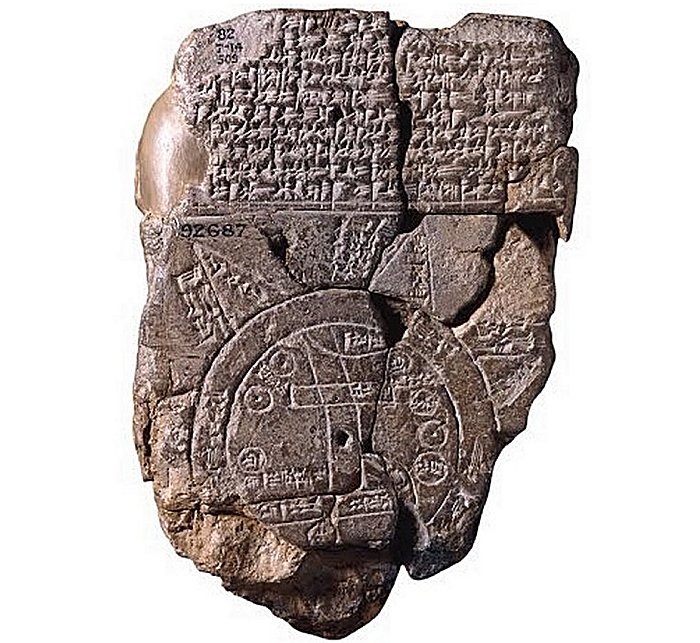
1. Timekeeping – some of the earliest calendars organized around 360 days are tracked back to the ancient Mesopotamian region around 2100 BCE. These diagrammatic charts “derive from observations of the heavens.” The figure below presented by Druckner (p. 72) is an image of early timekeeping visualizations.
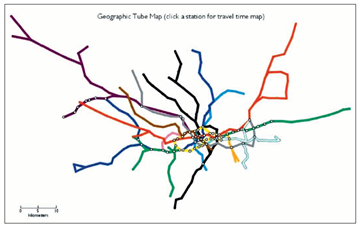
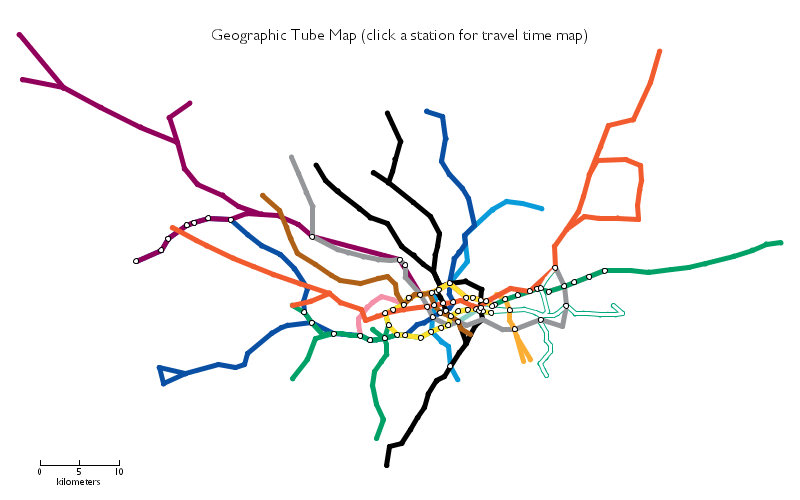
2. Space-Making – visualizations which “create spatial representations” perhaps “without referencing a pre-existing ground.” Druckner (p. 77) asks, “What is the figure of space that emerges from data, observation, experience, human record, when no a priori coordinates are used to structure that representation in advance?” This section explores the history of maps. One example from 1981 presented by Druckner (p. 83) is the London Underground map created by Tom Carden, as seen below.
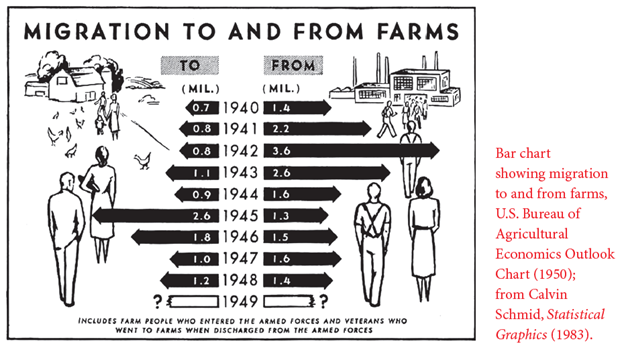
3. Administration and Record-Keeping – As indicated in the title, these visulazations arise for record keeping and administration. Druckner (p. 85) writes, “But as with mathematical forms, the graphical structures that support proto-writing participate in an essential stage of the development of graphical principles.” One visualization presented by Druckner (p. 87) shows the migration to and from farms as presented by the U.S. Bureau of Agricultural Economics in 1950, seen below.
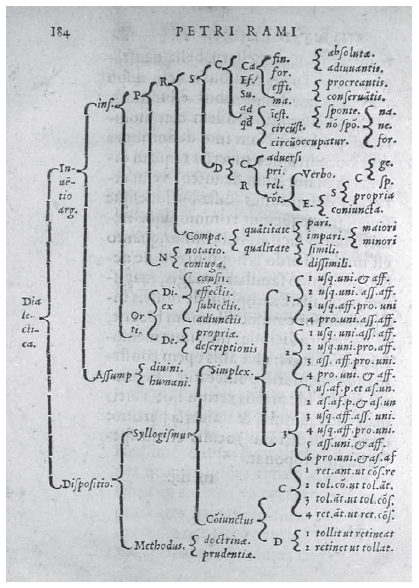
4. Trees of Knowledge – These visualizations are static, but traditionally represent “hierarchy, derivation, consanguity, proximity, and distance.” Ramus, as seen below and referenced by Druckner (p.98) is counted among the first to change the tree orientation in visualizations.
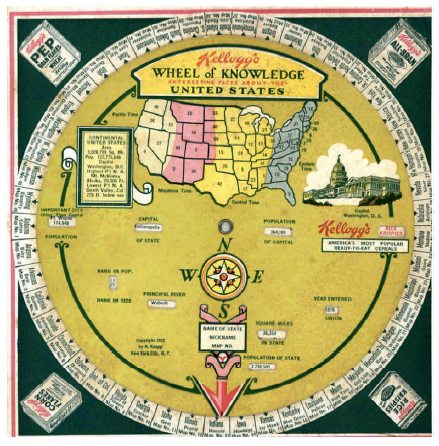
5. Knowledge Generators - These visualizations forms that support “combinatoric calculation (p. 105)” in that the “diagrammatic form produces multiple outcomes through the reading of variables against each other even though no part literally moves. (p. 107)” A landmark essay written in 1987 by Herbert Simon and Jill Larkin argue that “a diagram is fundamentally computational, and that the graphical distribution of elements in spatial relation to each other supported perceptual inferences that could not be properly structured in linear expressions, whether these were linguistic or mathematical. (p. 106)” Druckner (p. 105) references the below Kellogg’s Company Wheel of Knowledge.
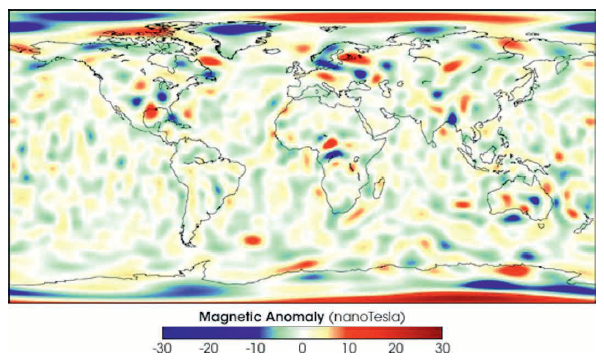
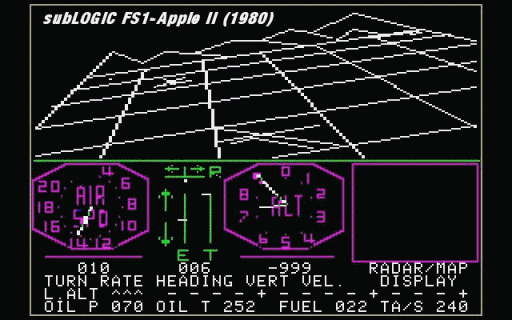
6. Dynamic Systems – Visualization which “make use of graphical organizations, operations, and relations to analyze or model events or processes. (p. 116)” Druckner explores visualizations by the Aristotelians for charts on earth, air, fire, and water. And, nearly ends the discussion with a discussion on magnetic activity visualization produced by NASA, as seen below (p. 123).
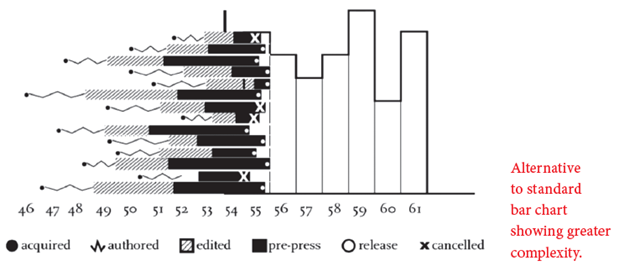
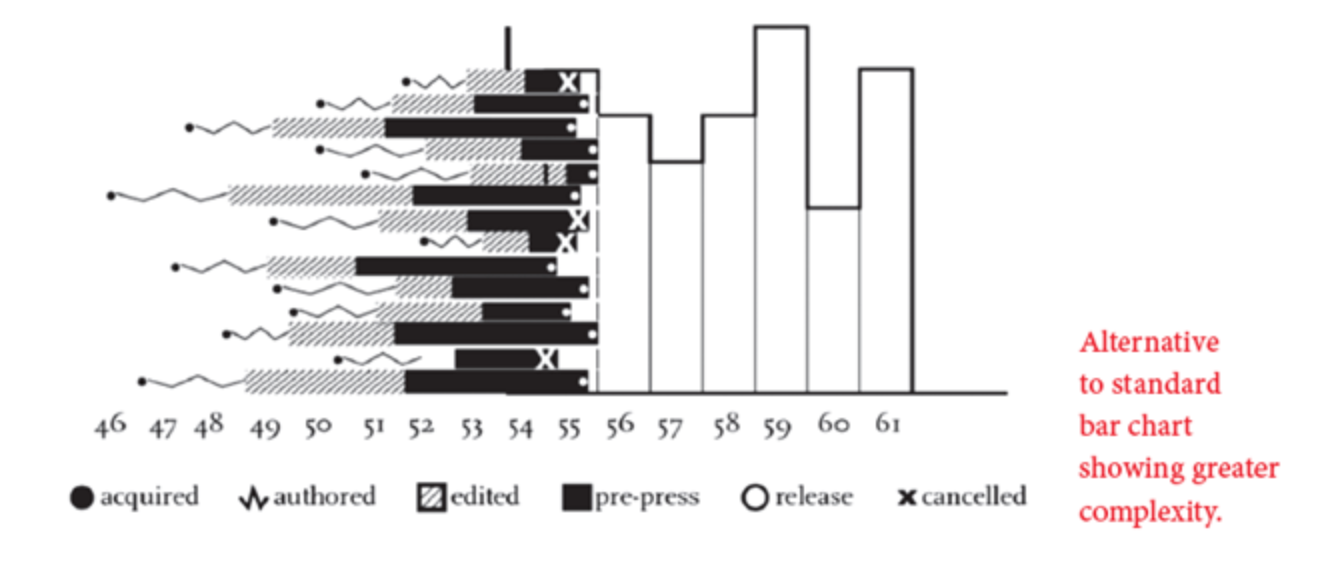
7. Visualizing Uncertainty and Interpretive Cartography – This section explores the ideas that “the fundamental parameters of chart production, are already interpreted expressions (p.129).” Druckner references the below image “Alternative to standard bar chart showing greater complexity” (p.127).
8. Humanistic Methods – are centered “in the experiential, subjective conditions of interpretation. (p. 130)” Druckner states, “The standard elements of graphic display for statistical information are simple and limited: scale divisions, coordinate lines, scale figures, circles, rectangles, curves, bars (or columns or percentages of pie charts or other forms) and labels (numbers and terms), signs of movement, flow, or state change (arrows, vectors, paths). The ordering and arrangement of elements within a chart create another level of information, relational information. Relational information is graphically produced; the ordering of elements by size, by color, by alphabetical order, by texture, shape, or other feature happens in graphical space. The resulting arrangement has a semantic value produced by features of proximity, grouping, orientation, apparent movement, and other graphical effects. (p. 131)”
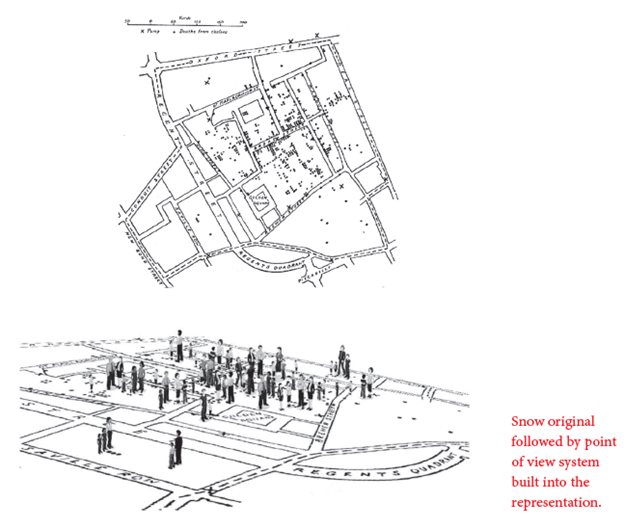
9. Visualizing Interpretation – Druckner (p. 135) references four basic levels of interpretation or knowledge production: (1) modeling phenomenological experience, (2) modeling relations among humanities, (3) modeling the representations of temporality, and (4) modeling the interpretation of any of the former. Druckner (p. 137) presents the final visualization by Snow on the deaths from cholera which she juxtaposes with a point of view system built into Snow’s representation, as seen below.
In this chapter, Johanna Drucker argues that data are “capta” and takes the reader through examples of both conventional and unconventional graphs to provide the reader with a greater understanding of the ways in which humans imbue their biases and opinions in data sets that we may perceive as objective. Describing data as objective ignores the fact that there is always a process of observation and interpretation in collecting that data.
Drucker turns to the presentation of a standard graph as an example of how it presents a distorted view of the facts. In the conventional form of a graph we render the statistical information in a simple and legible form that hides other aspects of the original framework on which the graph is constructed. One of her most interesting arguments is the rethinking of the approach to visualization and the assumptions that underpin them by representing ambiguity and uncertainty as the basis on which a representation is constructed instead of creating a graph as an effect of those ambiguities. She introduces an unconventional method of graphs which is focused on the humanistic approach- a premise rooted in the recognition of the interpretative nature of knowledge- to expose the constructed nature of data.
Through her suggestions of including a more humanistic approach, Drucker's hope is to highlight how these graphical forms are not neutral and suggest strategies, such as unequal measurements, to mark uncertainty and the involvement of interpretation clear.
What I like about the second chapter of Drucker’s Graphesis is how she draws timelines of different lineages of information visualizations and the overall arc of these lineages that finally leads her to her own vision of a humanist / constructivist approach to data visualization.
After getting familiar (maybe too familiar) with her method – first identifying what appears to be familiar, normal or natural and understanding that it’s actually result of human conception rendered opaque by convention; followed by tracing its history and origin, incentives and agendas in its development to finally be able to find new forms of representation that make these processes more transparent – I tried to focus more closely on the huge list of examples she structures in seven categories:
And finally a category for her own vision of “humanistic” visualizations:
Even though it’s not directly related to visualization practice, I wanted to start with a few remarks on her method. While I agree with her approach and think it’s generally a valuable exercise to de-normalize what is understood to be data in it’s most basic meaning – given – I sometimes wished for a more comprehensive argument and some reflection on her own position. For example when she repeatedly states that spatial organization was an important tool to solve previously unmet challenges it would have been interesting and helpful if she provided more insights into her research in which way positioning and spatial organization actually conveyed meaning or helped solve problems. While she did this roughly for addition organized in columns, and I can try and unravel what she means by claiming that Babylonian development of multiplication and division would have been “impossible to perform without spatial organization in which the numbers hold value through position.” (p. 84), the fact that she doesn’t account for the statement disincentivizes questioning it. Maybe there could have been other ways to organize thought to conceive these operations. In other cases, her claims are so general that I would need to follow her research beyond the scope of her book to really understand how space organized meaning.
After reading about her vision of visualizing uncertainty and interpretative cartography I really appreciated the groundwork she laid out in the previous sub-chapters. For example deconstructing the idea of linearity of time and its scales and measurements then finally makes sense when it’s the foundation to find new ways to represent a timeline.
What I find really helpful for a visualization practice is to identify the graphical conventions and their connotations to think about the possibility if the data one wants to visualize might allow to depart from these conventions. And it’s also really helpful that she identifies normalized concepts on different levels and different degrees of abstraction. The following list includes just a few examples that stuck with me and is by no means exhaustive:
While I find her last sub chapter fascinating and motivating to approach data visualization differently it also motivated me approach her project with her own method which raised a lot of questions for me:
Why does Drucker conflate humanism with constructivism? What ideas are conveyed and connotated when some types of of graphical tools are called knowledge-generators? How do we find out about the agenda of the author? Or is the own agenda always to some extent opaque to the author? When criticizing conventional ways of visualizations why does Drucker assume a realistic approach (p. 126), when it’s quite possible that it’s just a pragmatic one? When reinventing Snow’s chart of deaths from cholera for example, Drucker imagines a lot of different layers, how would we find out about the various different purposes of this chart, what would the overall purpose of it be and would it still enable us to track the source of the epidemic to a single water pump?
At the end I was a bit disappointed by the examples she decided to show for the new humanistic approach to visualization. It falls behind her ambitious description.
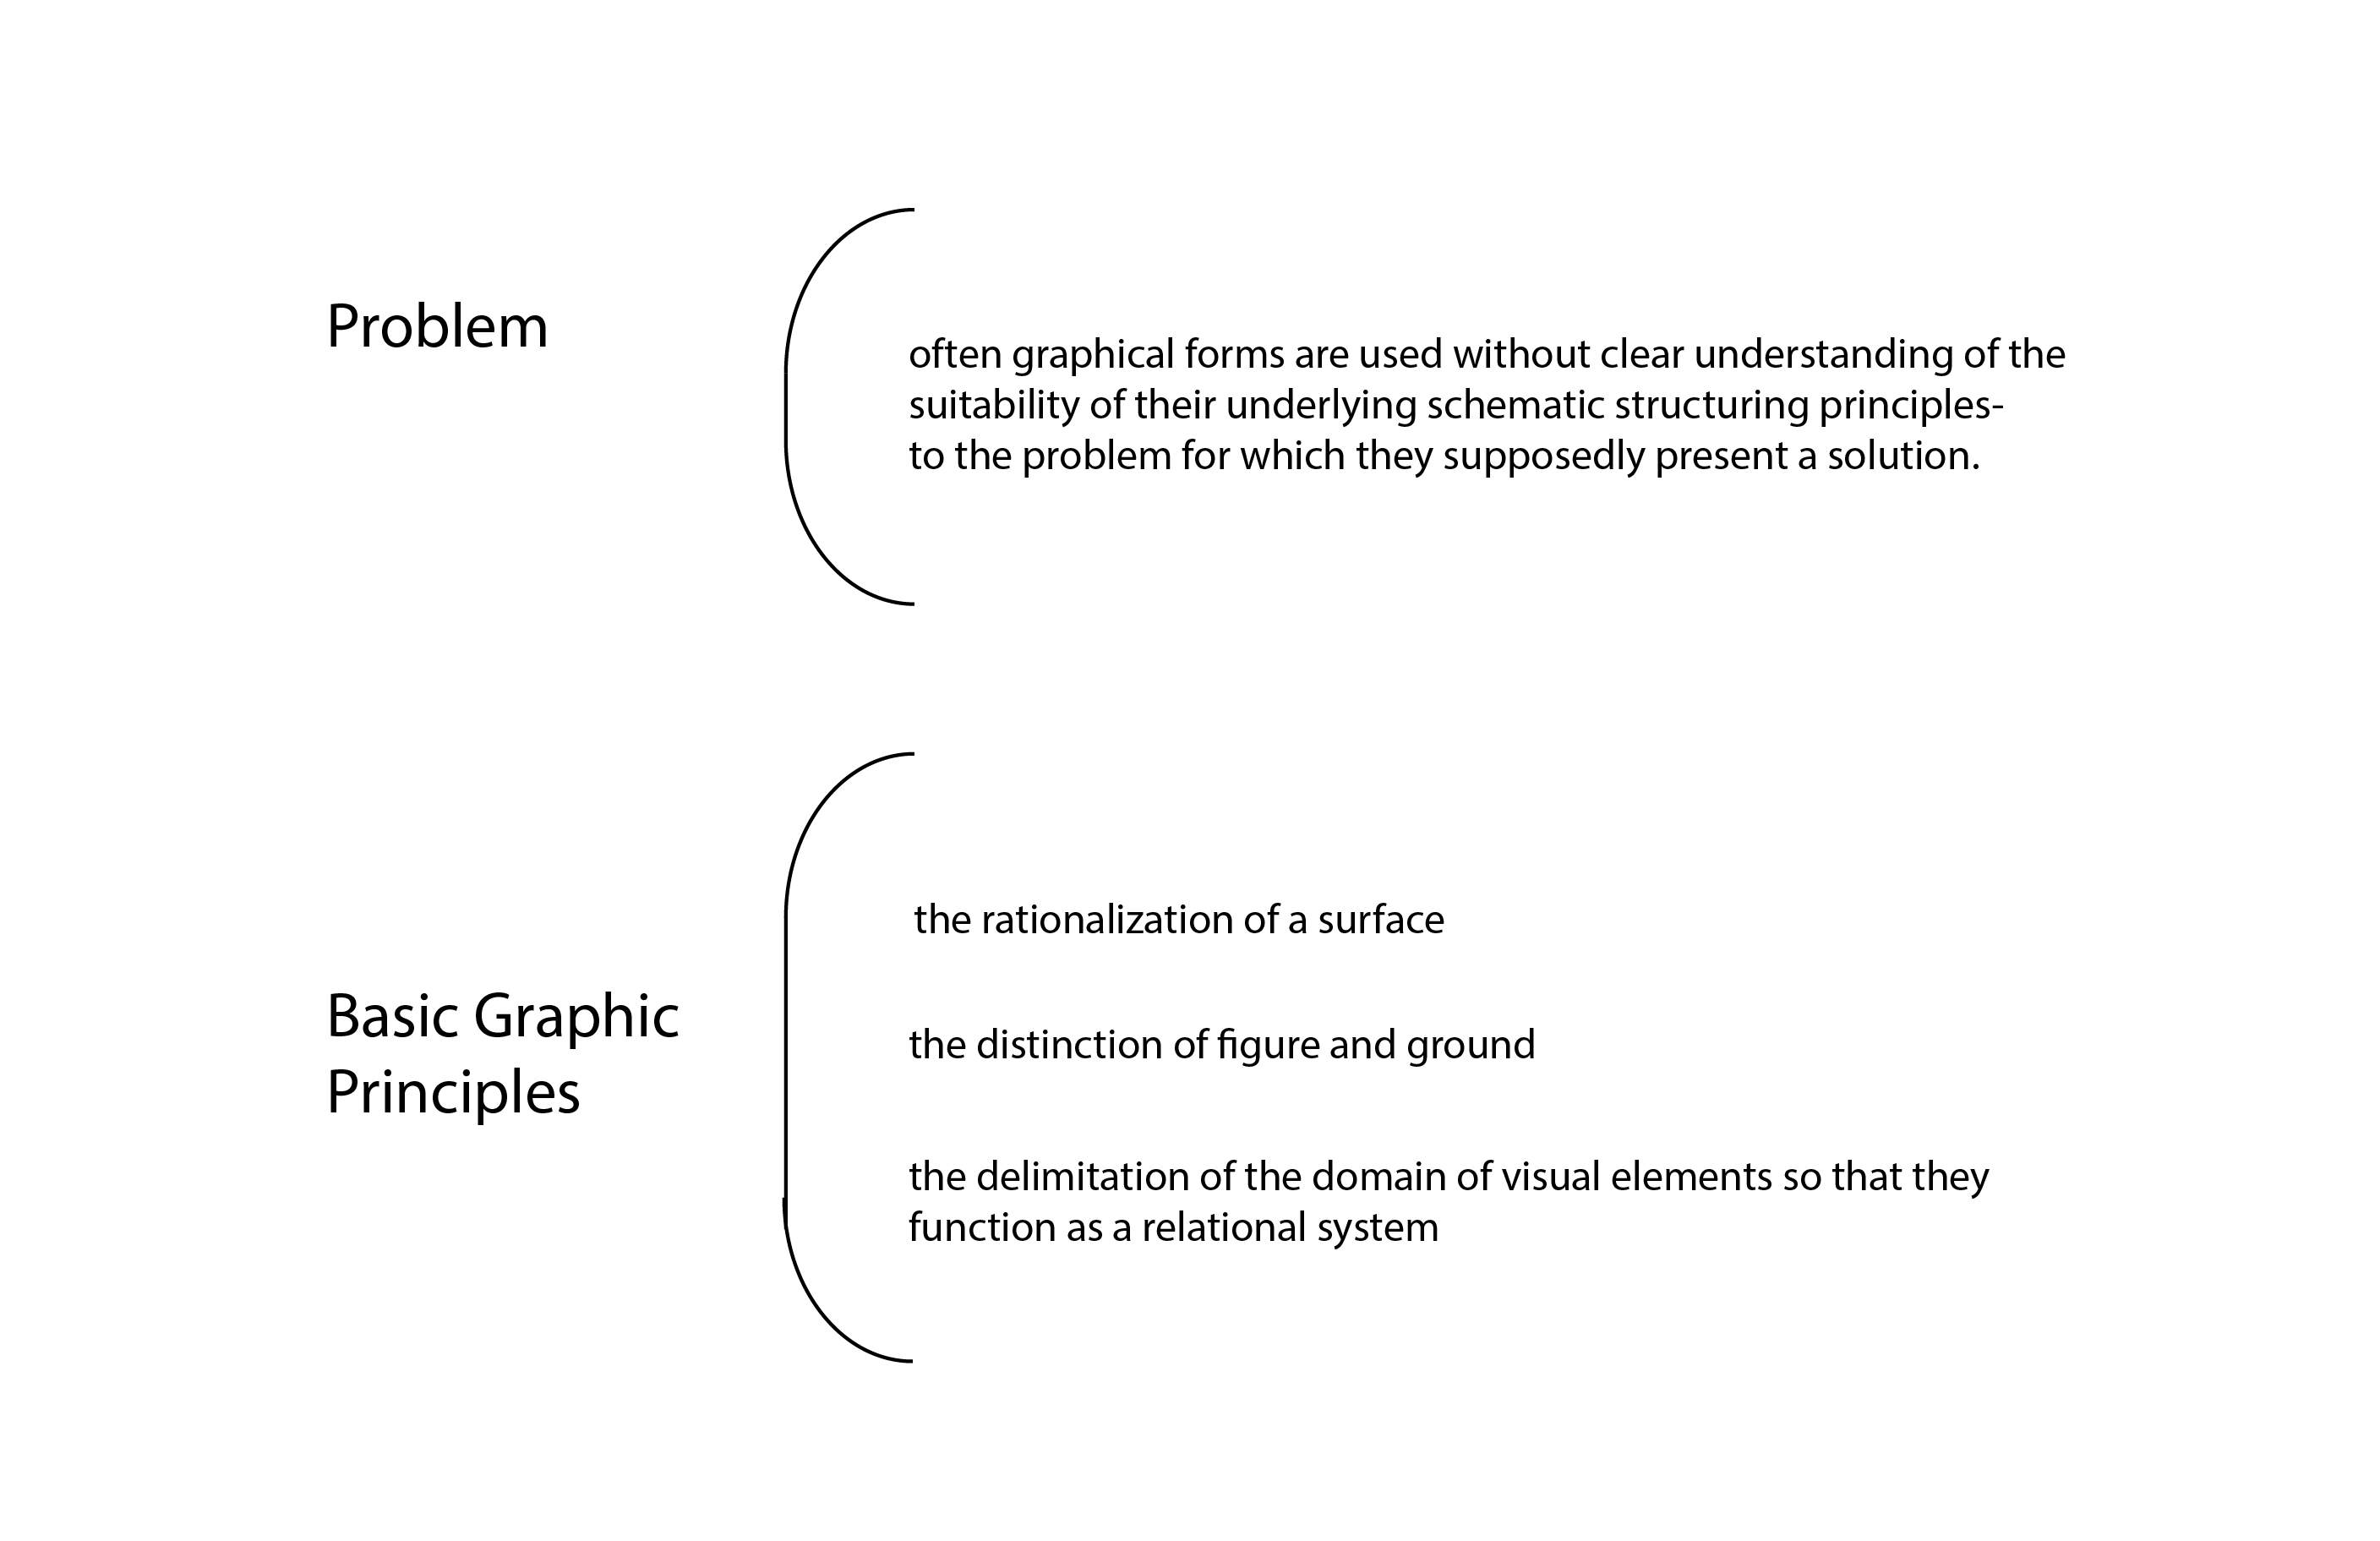
In chapter two, Interpreting Visualization Visualizing Interpretation, Drucker describes various graphical formats, such as maps, tables and charts, to dive deeper into the study of visualizations. In the beginning of the chapter, Drucker makes an important distinction between visualizations that are representations and those that are knowledge generators. While representations are static and present information that is already known by the viewer, knowledge generators are dynamic and have the ability to create new information. A key element Drucker points out is that all visualizations and diagrams rely on three distinct principles:
Throughout the chapter, Drucker takes the reader on a journey from the origins of visualizations, beginning with timekeeping. Timekeeping is the earliest form of a chart or diagrams and was essentially created in 2100 BCE in the ancient Mesopotamian region. However, Drucker argues that the idea of time is highly subjective as the “share of temporality is an expression of belief, not a chart of standard metrics. Drucker then describes space-making which is essentially about creating spacial representation without using prior coordinates to structure the representation. This leads Drucker to explore the history of Maps using various examples including Portolan Charts and Tom Carden’s London Underground Map. Following this, Drucker goes into Administration and Record Keeping which looks at the arrangement of information into tables, as demonstrated by the use of clay tablets to separate signs of different types in the fourth millennium. Another type of visualization discussed in the chapter are Trees of Knowledge which are commonly used in databases and structured data files. This is primarily due to the fact that trees of knowledge are static and fixed but also carry meaning in them. Similarly, knowledge generators are also static but can be mobile as well. Knowledge generators support “combinatoric calculation”, meaning their features allow their components to be combined in many different ways. Lastly are dynamic systems, consisting of dynamic elements such as vectors and graph lines, which result in the display of processes rather than products.
Drucker ends the chapter by discussing "visualizing uncertainty", taking into account that assumptions and rhetoric are often attached to visualizations. She also discusses humanistic methods which shift away from standard metrics and statistical graphics and lean more towards interpretative graphics. In the final part of the chapter, Drucker proposes a new model for humanistic work that can be applied across various domains. She uses the example of the shift from observer-independent realism to co-dependant constructivism to solidify her proposal.
Johanna Drucker starts off by clearly making a distinction between Visualizations that represent information, and those that are knowledge generators - which creates new interpretations and information from their use.
She breaks down the visualizations by:
* Graphical Formats - bar charts, line graphs, etc
* Intellectual purpose or Function - mapping, navigating, calculation, etc.
* Type of content - spacial, quantitative, qualitative, temporal, etc.
* The way they structure the meaning - analogy, comparison, vectors, columns, etc.
She goes on to describe our historical reference to visualizations through:
Humanistic Methods - a humanistic method of looking at data is ordered subjectively. But doesn't everything have a 'point of view'? That is the 'fuzzy logic' of the data – and constructing the graphical interfaces cannot be standardized. ANXIETY – or an interpretation of anxiety exposes the information, rather than conceals. Who decides how this is displayed? Who has that authority?
My take: I enjoyed this chapter very much – especially as it moved towards questioning our ability to understand how to 'humanize' the data.
Drucker prefaces her second chapter, "Interpreting Visualization :: Visualizing Interpretation," with the concept that every visualization can be categorized as either representations or knowledge generators. The difference is representations are of information that is already known, whereas knowledge generators create new information through their use. This is important context as we read through the history and analysis of visualizations related to time, space, and many other subjects in this chapter.
Since this was a bit of a lengthy chapter, I'll highlight my top insights across Drucker's 8 sections.
One of the most important pieces of time keeping, is that it's based on a shared cultural understanding. Often rooted in religious markers in time (pre / post Messiah, etc.), societies based time keeping on events that everyone in their society could perceive or reference. One of the most critical points here is that "the shape of temporality is an expression of belief, not a chart of standard metrics" (p. 76). We all experience time in different ways based on how we're feeling. A slow line, a boring movie, a fun party will all feel different even if they span the same length based on our emotional disposition. Interestingly, we can feel an hour even though it's not based on any natural law like a day or year is. That's an example of another shared cultural understanding. The Earth has no concept of an hour, but yet we as humans do.
In order to provide context, Drucker informs us that maps have two distinct purposes: to navigate and to communicate ownership. In early maps, the ability to "project a multidimensional form from a flat drawing" (p. 78) was a significant milestone technical achievement, in reference to Babylonian clay property map. This got me thinking about our current maps, specifically the mercator projection which distorts and exaggerates landmasses in order to accurately translate directional/navigation information. "The constructed experience of space cannot be presented in standard cartography any more than the variable concepts of temporality be charted on a standard timeline. (p. 82) To me, that's a very profound and accurate insight. While looking at a map, we feel it is an accurate representation of real life, there's always going to be some level of abstraction necessary even if users do not consciously perceive it that way.
By far, the most interesting point made here is in regards to the visualization of tabular data forms. Specifically, that is may "be the first fully diagrammatic human activity...which that spacial ordering has no analogical reference or prior existence." (p. 86) I had never thought about this before but it makes sense and it's extremely interesting to consider. Everything graphic up until tabular data forms had been an abstraction of real life in some way (time, space, etc.) but the data tables we see every day were created uniquely for a graphic purpose. The core design principles of alignment and typography are proven here. And from there, we go on to get graph paper, grids, and sophisticated layout structure intended for optimal human-readable form often used in administrative tasks.
A tree is an allegorical symbol with roots in many cultures and religions, like the tree of life. It makes sense that we use trees to model databases and other complex data structures like a family tree (probably the most direct parallel). Trees are a great example of knowledge generators because the spatial arrangement of the branches, leaves, etc. produce meaning in itself – not just in the nodes/branches.
As mentioned before, knowledge generators create meaning through combination and spatial positioning. An example of this is the Kabbalah Sephirotic Tree that teaches the nine orders of angels. This is a distinct diagrammatic example of a spiritual graphic. To gain spiritual knowledge, "the mind must move through its structure to engage." (p. 111) therefore, creating new meaning through combinatoric and spacial features.
Additionally, the Venn diagram is another knowledge generator; however, it's worth pointing out that the circular form used to bound items inside, doesn't mean anything except to communicate the category those items live. In other words, the fact that it's a circle, doesn't matter. It's not a representation of anything real. It could just as easily be a square.
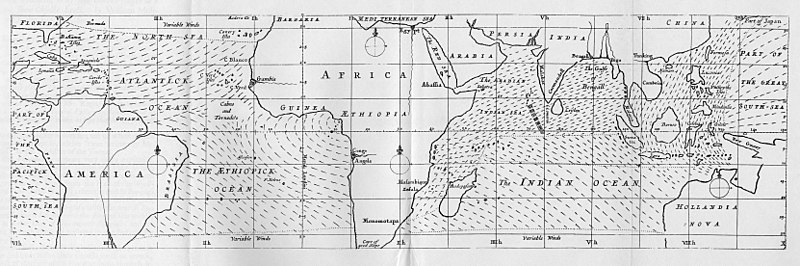
Visualizing weather, an event that marks state changes, is an example of a dynamic system – often difficult to visualize in a static graphic format. Additionally, representing tides and currents on top of cartography (like when we see the hot air gusts over the map of the USA on tv) were first mapped in 1686 by Edmond Halley. The ability to show wind gusts, atmospheric changes, thunderstorms, etc. all depict process and change in a dynamic system on a static graphic. Once the ability to generate motion graphics because possible, we could visualize "spacial-temporal illusions" that make mapping things like weather events conceptually easier to understand, even if they are mathematically inaccurate.
"Realist approaches depend above all upon an idea that phenomena are observer-independent and can be categorized as data." (p. 125) I appreciate Drucker's sentiment here, that data collection and observation are not the same thing. The act of collecting data always needs to be evaluated as an observer interpretation by the collector and not the representation of raw facts. Restated by Drucker later, "the fundamental parameters of chart production, are already interpreted expressions." (p. 129) When people look at a bar chart or pie chart, they don't question it and assume they're looking at unfiltered data even if there are gaps in the data, but this implicit trust needs to be questioned, "all data is capta."
This chapter, towards the end of the section, gives us a bit more insight into Drucker's personal feelings of capturing and visualizing data. In fact, we're told to suspend the conventional standards of graphical structure in favor of a humanistic interpretation...a push to do something different even if it's not perfectly legible or follow the rigid rulesets. There's an emphasis on not collecting data as unbiased and objective as possible, but to focus that moment of observation and pivot to consider interpretation first. Let yourself be affected by the thing you are observing.
Finally, in the concluding section, we are taught we must focus on the "interplay between a situated and circumstantial viewer and the objects or experiences under examination or interpretation" (p. 136), which I took to mean that there's always a connection between real life and graphic design. Essentially, there's something you're observing in the real world that must be interpreted, recorded, and abstracted to ultimately become a graphical visualization – and it's our responsibility as designers to translate that process to our final design which the viewer only sees.
In this chapter, Drucker traces the history of data visualizations, noting that “the roots of tables, and charts, calendars and timelines, maps and diagrammatic forms are as old as writing and record-keeping.”
She begins by offering rubrics for which to study this history. Drucker states that information graphics can be organized into two types: static representations like calendars and knowledge generators such as train timetables. Another way of breaking down visualizations she presents is by graphic format, intellectual purpose, type of content and the way meaning is structured. Finally, she structures her exploration into nine types of visualization, leading from timekeeping and space-making through administration and record-keeping, on to trees of knowledge, knowledge generators, dynamic systems and visualizing uncertainty.
Visualizations have their deepest roots in timelines, calendars and maps, beginning in Mesopotamia with solar and lunar timekeeping, and in maps that were used for navigation and delineation of property.
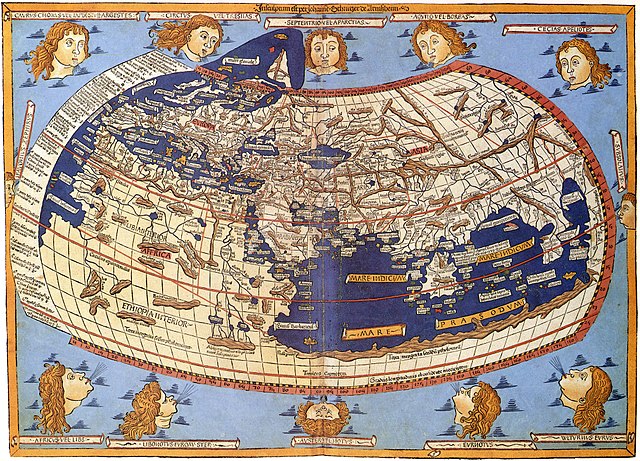
Calendars developed further in Roman culture, while Greco-Roman polymath Ptolemy was the first to offer a gridded map spanning the known world. Drucker stresses the process of abstraction behind both calendars and mapmaking: the use of spatial reasoning abstracted from specific observations and the construction of analogies from three to two dimensional space.
She notes similarities in visualization methods that have carried through since ancient times: rationalization of a surface; distinction of figure and ground; and delimitation of visual elements so they function as a relational system.
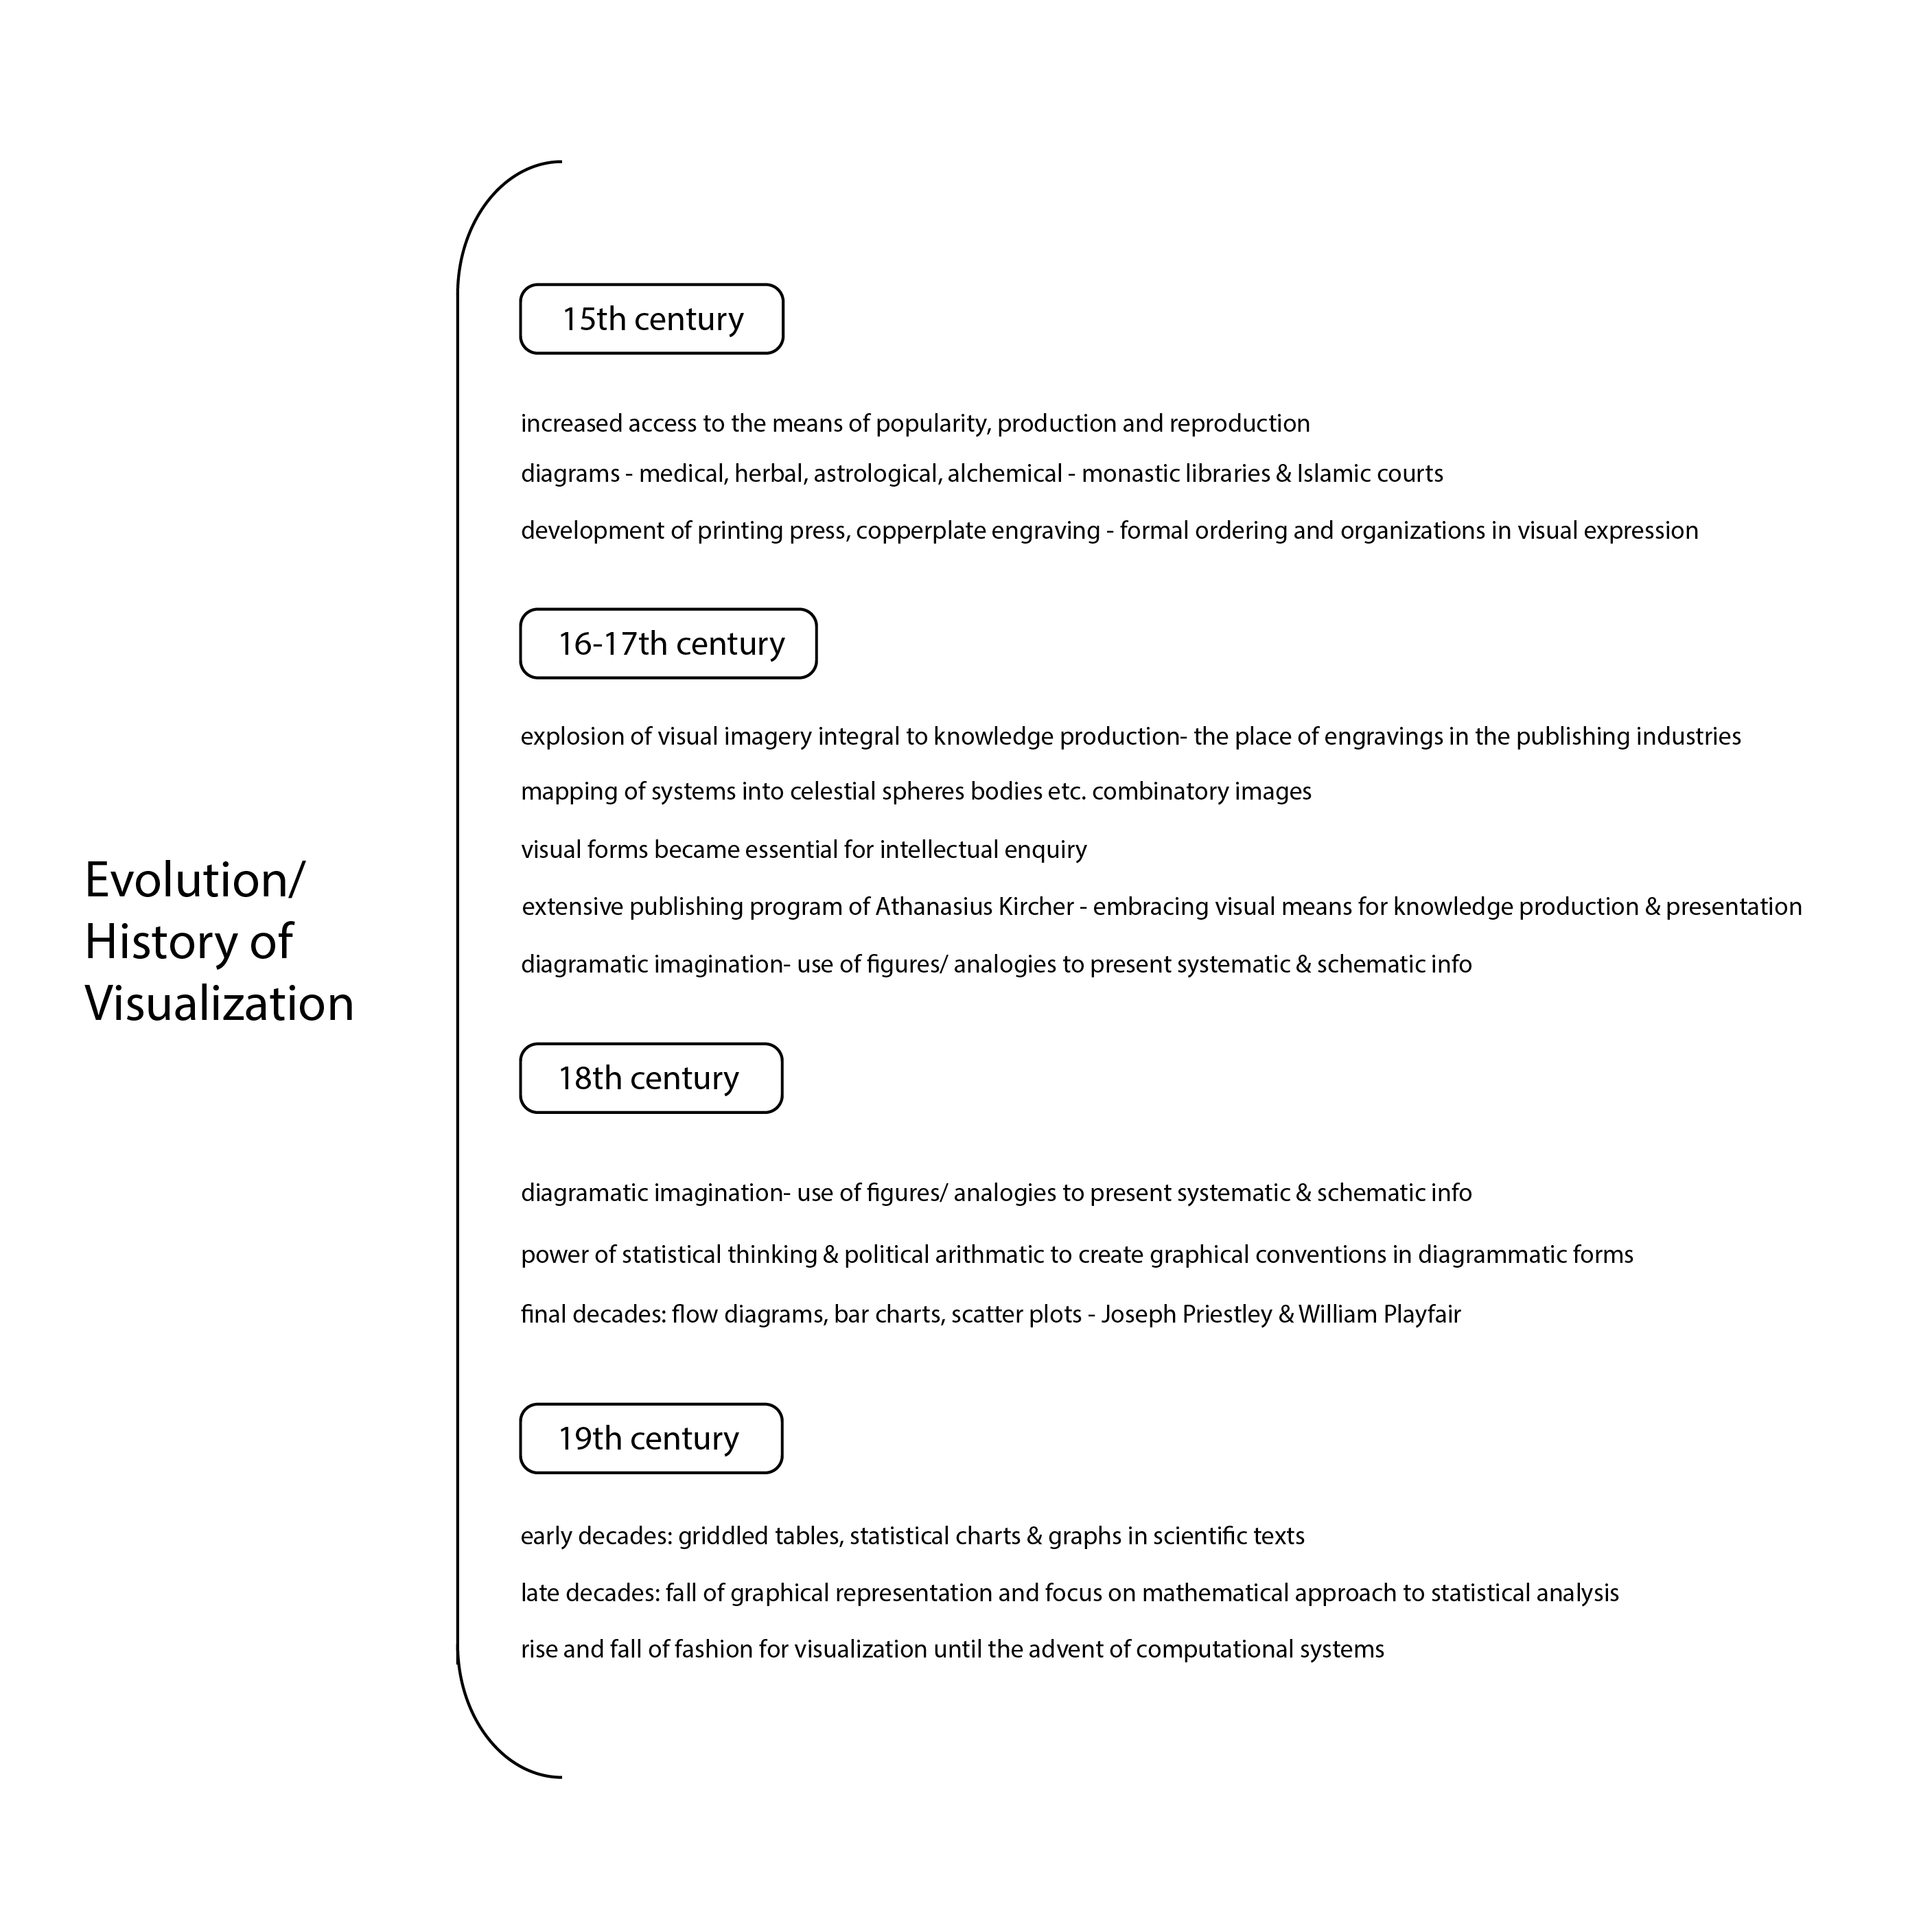
Visualizations were often restricted to Judeo-Christian mythology in the Middle Ages, but the printing press and development of scientific instruments led to an explosion from the 16th century onward. The first examples of bar charts and scatterplots appear with Priestley and Mayfair in the 18th century.
Drucker roots statistical graphs in Cuneiform tables from the fourth millennium BC, and establishes modern data visualizations in the growth of administrative states in the 17th and 18th centuries and their need to manage large populations. Descartes, for example, established the mathematical basis (planes, points etc.) for graphs in the 17th century. New scientific instruments for measuring weather such as thermometers and barometers also provided numerous data points that could be charted.
After tracing the evolution of information visualizations into the 20th century and the complexities of visualizing uncertainty such as dynamic weather systems, Drucker focuses on their interpretative aspect. This is the most polemical section of the chapter. Drucker notes that decisions about how statistics are translated into graphics are crucial, warning that this process is reductive and can lead to pseudo social sciences like eugenics, which gained authority by abstracting supposedly empirical methods and using visualizations to make reductive arguments visible.
Drucker calls on us not to adopt natural science models in the humanities unquestioningly, or “suspend critical judgement in a rush to visualization.” Instead, she proposes a humanistic approach that acknowledges the interpretive character of data, noting that “all data is capta.” For example, edges could be permeable and lines curved in a “constructedness” that displays the codependent nature of observer and phenomena.
I found Drucker’s presentation of the history of data visualization encyclopedic, in that it offers not just a chronology but also a framework for understanding its development over millennia, as well as guidelines for an ethical future.
But this reading left me with two principal questions. First, as a student of Asian history, I found the lack of an examination of the sophisticated visual and analytic traditions of South and East Asian civilizations to be a weakness. Where do these traditions fit into the overall picture of data visualization, and what does the growing influence of Asian nations portend for the development of the field? Second, Drucker's exhortation for a humanistic approach to data visualization seems warranted, but her examples of how to resolve the tension between what is an inherently reductive process with a visual "fuzzy logic" seemed a bit thin.
The author believes that one of the effective ways of interpreting the visualizations is understanding their origin, the logical reasoning - why it was created, what kind of information it represents, how did representations develop into the current approaches - in short, an evolution of the visualizations.
She takes us on a journey distributed among nine different fields/types/purposes of explorations in diagrammatic representations, as mentioned in the chapter, timekeeping, space-making, administration and record keeping, tree of knowledge, knowledge generators, dynamic systems, visualizing uncertainty and interpretative cartography, humanistic methods and visualizing interpretations. Attached here are some notes of points from the reading I found effective, even in some cases, for future use to come back to/ research more on:
She mentions some of the great contributors in each of these areas of visual exploration, the 'why'/'what' behind their works, intentions what event lead to what event followed by what - a journey in time, a detailed build up to where we stand today in terms of visual expression. In timekeeping, she discusses the origins of the different calendar systems representing the variety of ways of interpretation and representation of time, with origins especially in celestial objects and activities:
One of the points I found particularly effective (since it probably help me look at things in different light) was , in the ' Humanistic Methods' section -
Captcha is not an expression of idiosyncrasy, emotion, or individual quirks, but a systematic expression of information understood as constructed, as phenomena perceived according to principles of observer-dependent interpretation.
The section space-making reminded me of Einstein's theory of relativity wherein he elaborates planes of references. I remember a quote I read somewhere- "God is merely a frame of reference." I wonder if this thought was stemmed from one of the contributions to space-making. Is it too soon for humanistic thinking? Let's just keep the discussions to scientific representations of space such as coordinate systems, frames of reference, shape of the world and what connects humans to God.
What I find interesting from this section is the idea that we take tables for granted, because they are so widely used. Tables, with its rows and columns actually organize/group information which is already a major contribution towards diagrammatic representation and an accurate example of the concept of figure and ground. We are already putting info in a certain structure, helping us well enough to comprehend it in a better way. Hence, tables can also be considered as a diagrammatic representation of information.
Trees of knowledge are static structures well equipped to represent hierarchical information. The spacial distances and positioning of the entities in a tree structure establishes the relationship in this graphical representation. Although, due to their static nature, they have limitations or could be called "inflexible", they are one directional (and the direction of the connection cannot be reversed).
Knowledge generators are flexible unlike trees. One can have different variables interact with each-other and produce unexpected combinations as a result of it. Some of the contributions mentioned in this section are very interesting, although, due to limited time I could not deep dive into understanding them at the moment. Knowledge generators are based on mathematics- permutations, combinations. Although, I feel it goes both ways, diagrammatic representation of the mathematical results or other way around.
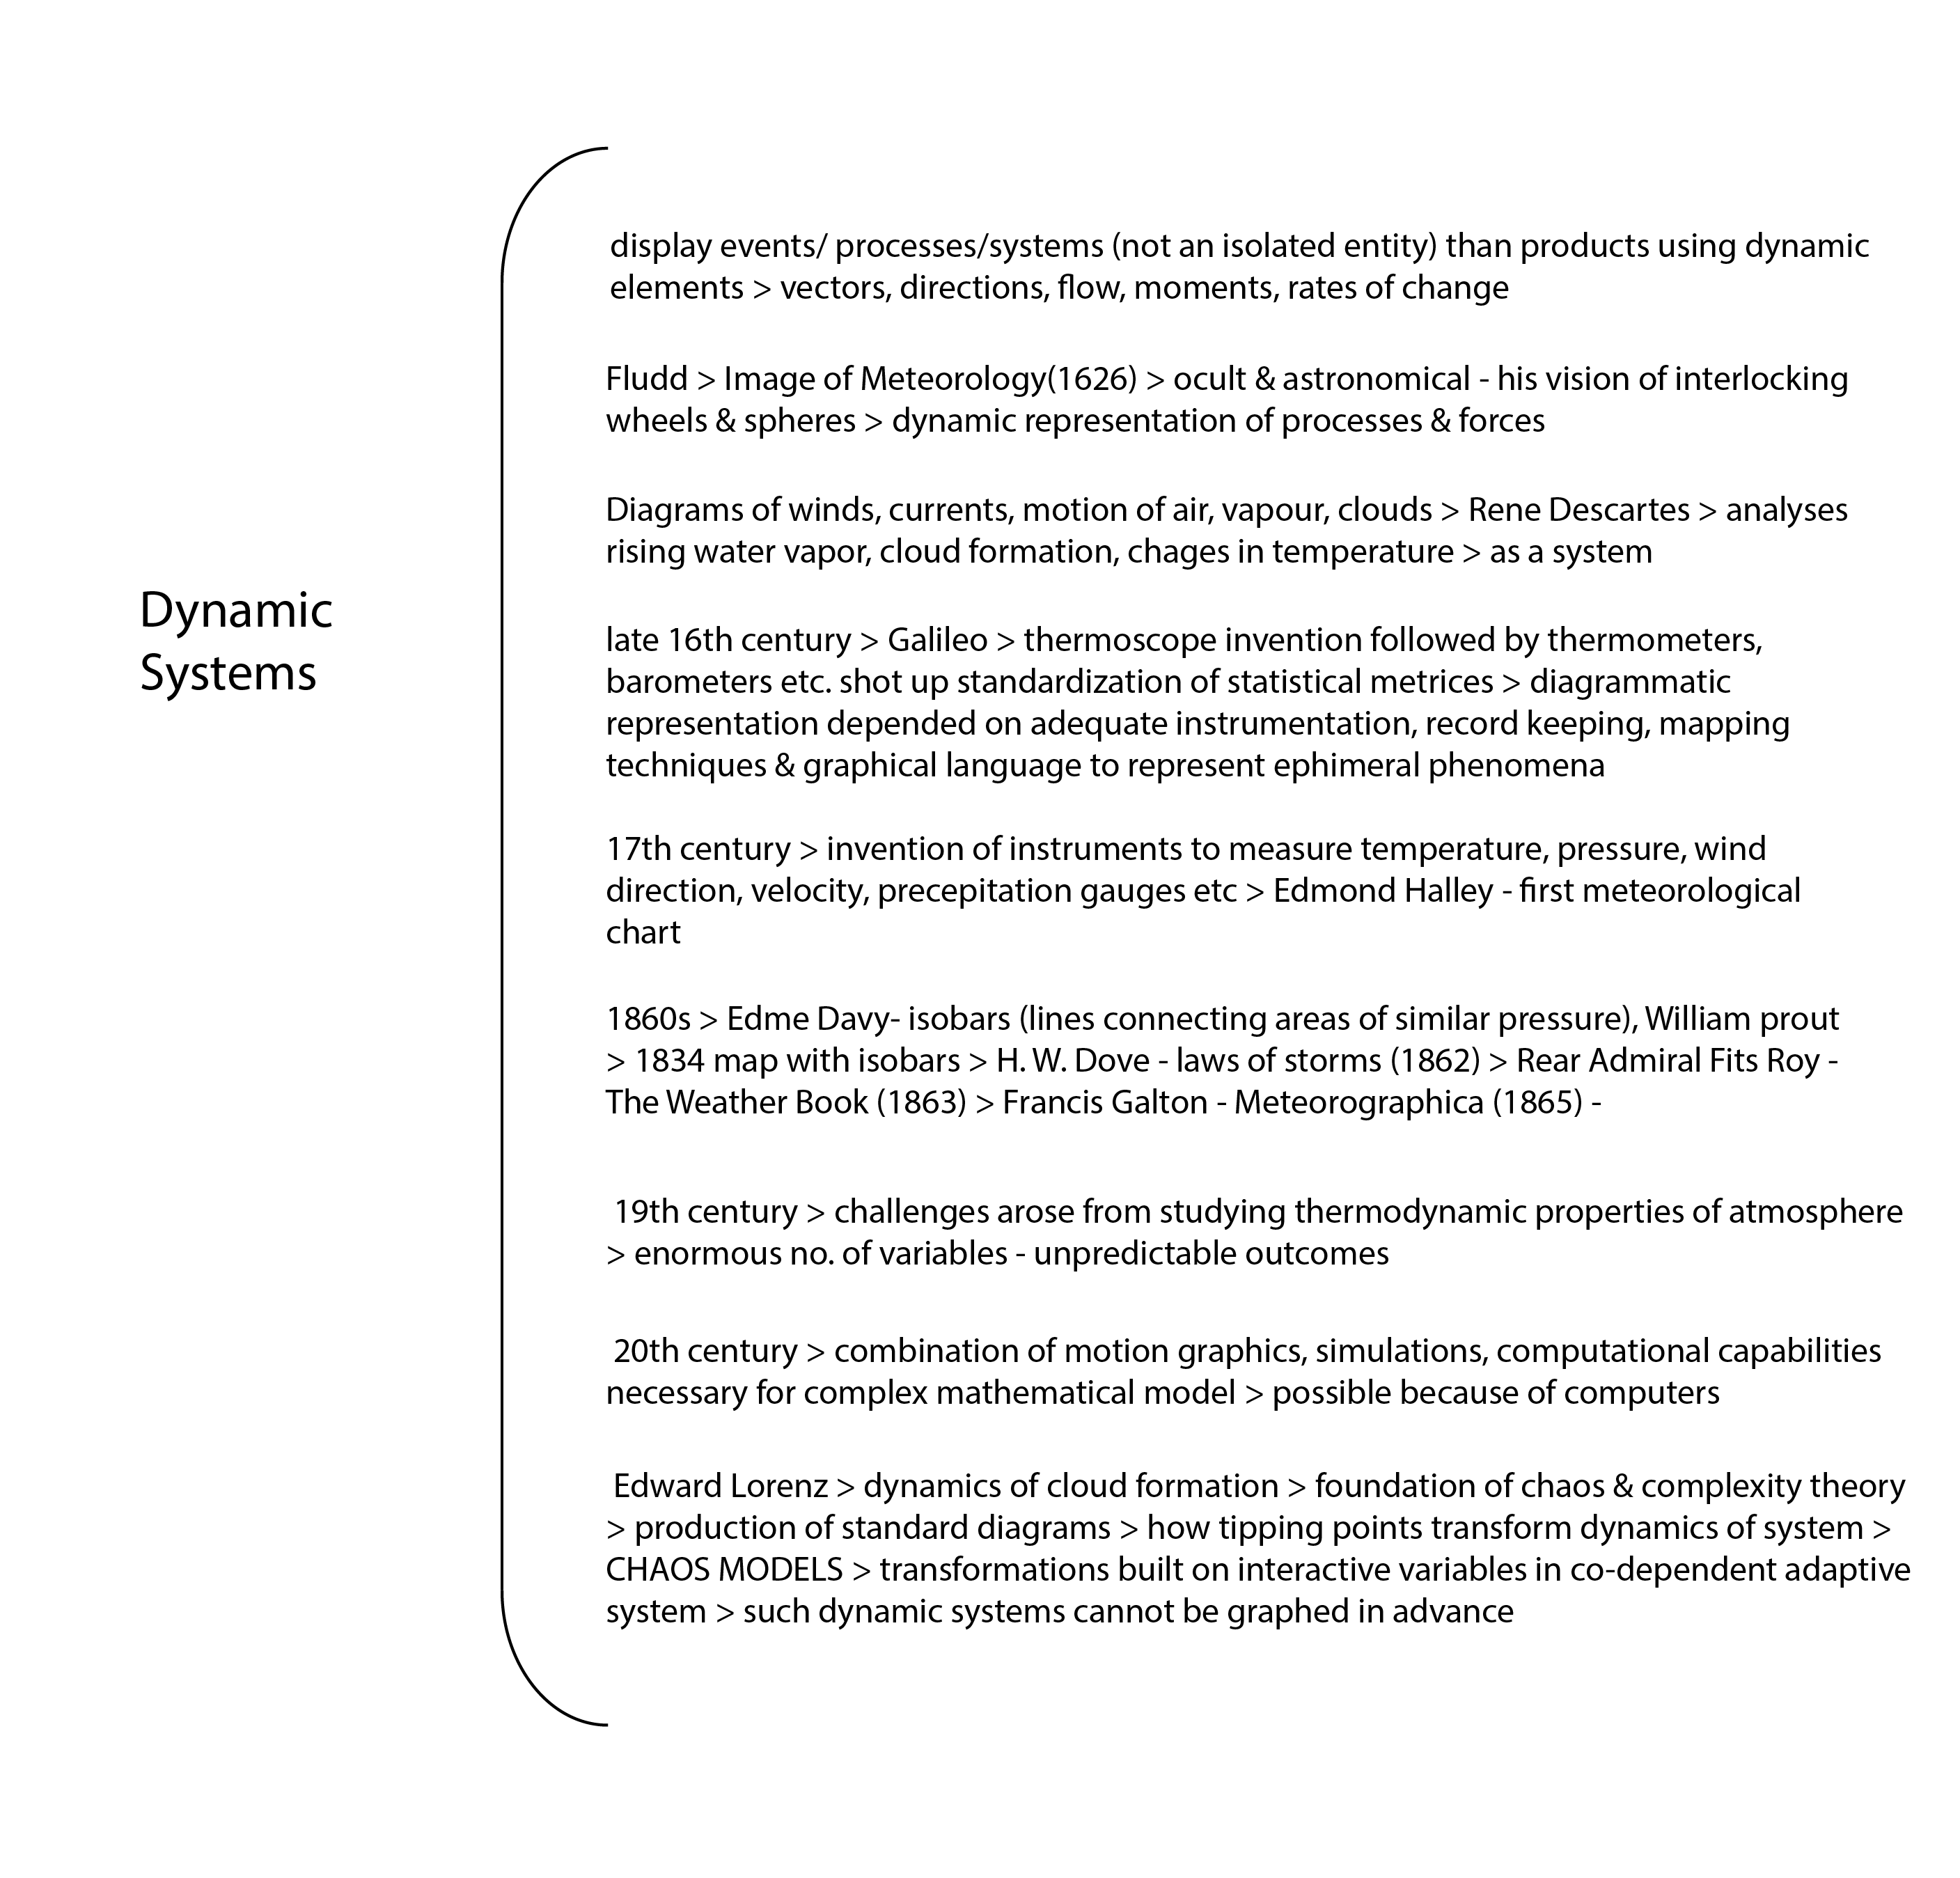
Dynamic systems are basically built around the concepts of representational system/ processes/ events (carefully note that it's not a single relation/entity it's the entire system) - mostly continually varying events such as motion of water, air currents, clouds, direction chaos, pressure etc. With the invent of the instruments to measure such events, it became a necessity to express the measurements diagrammatically with vectors.
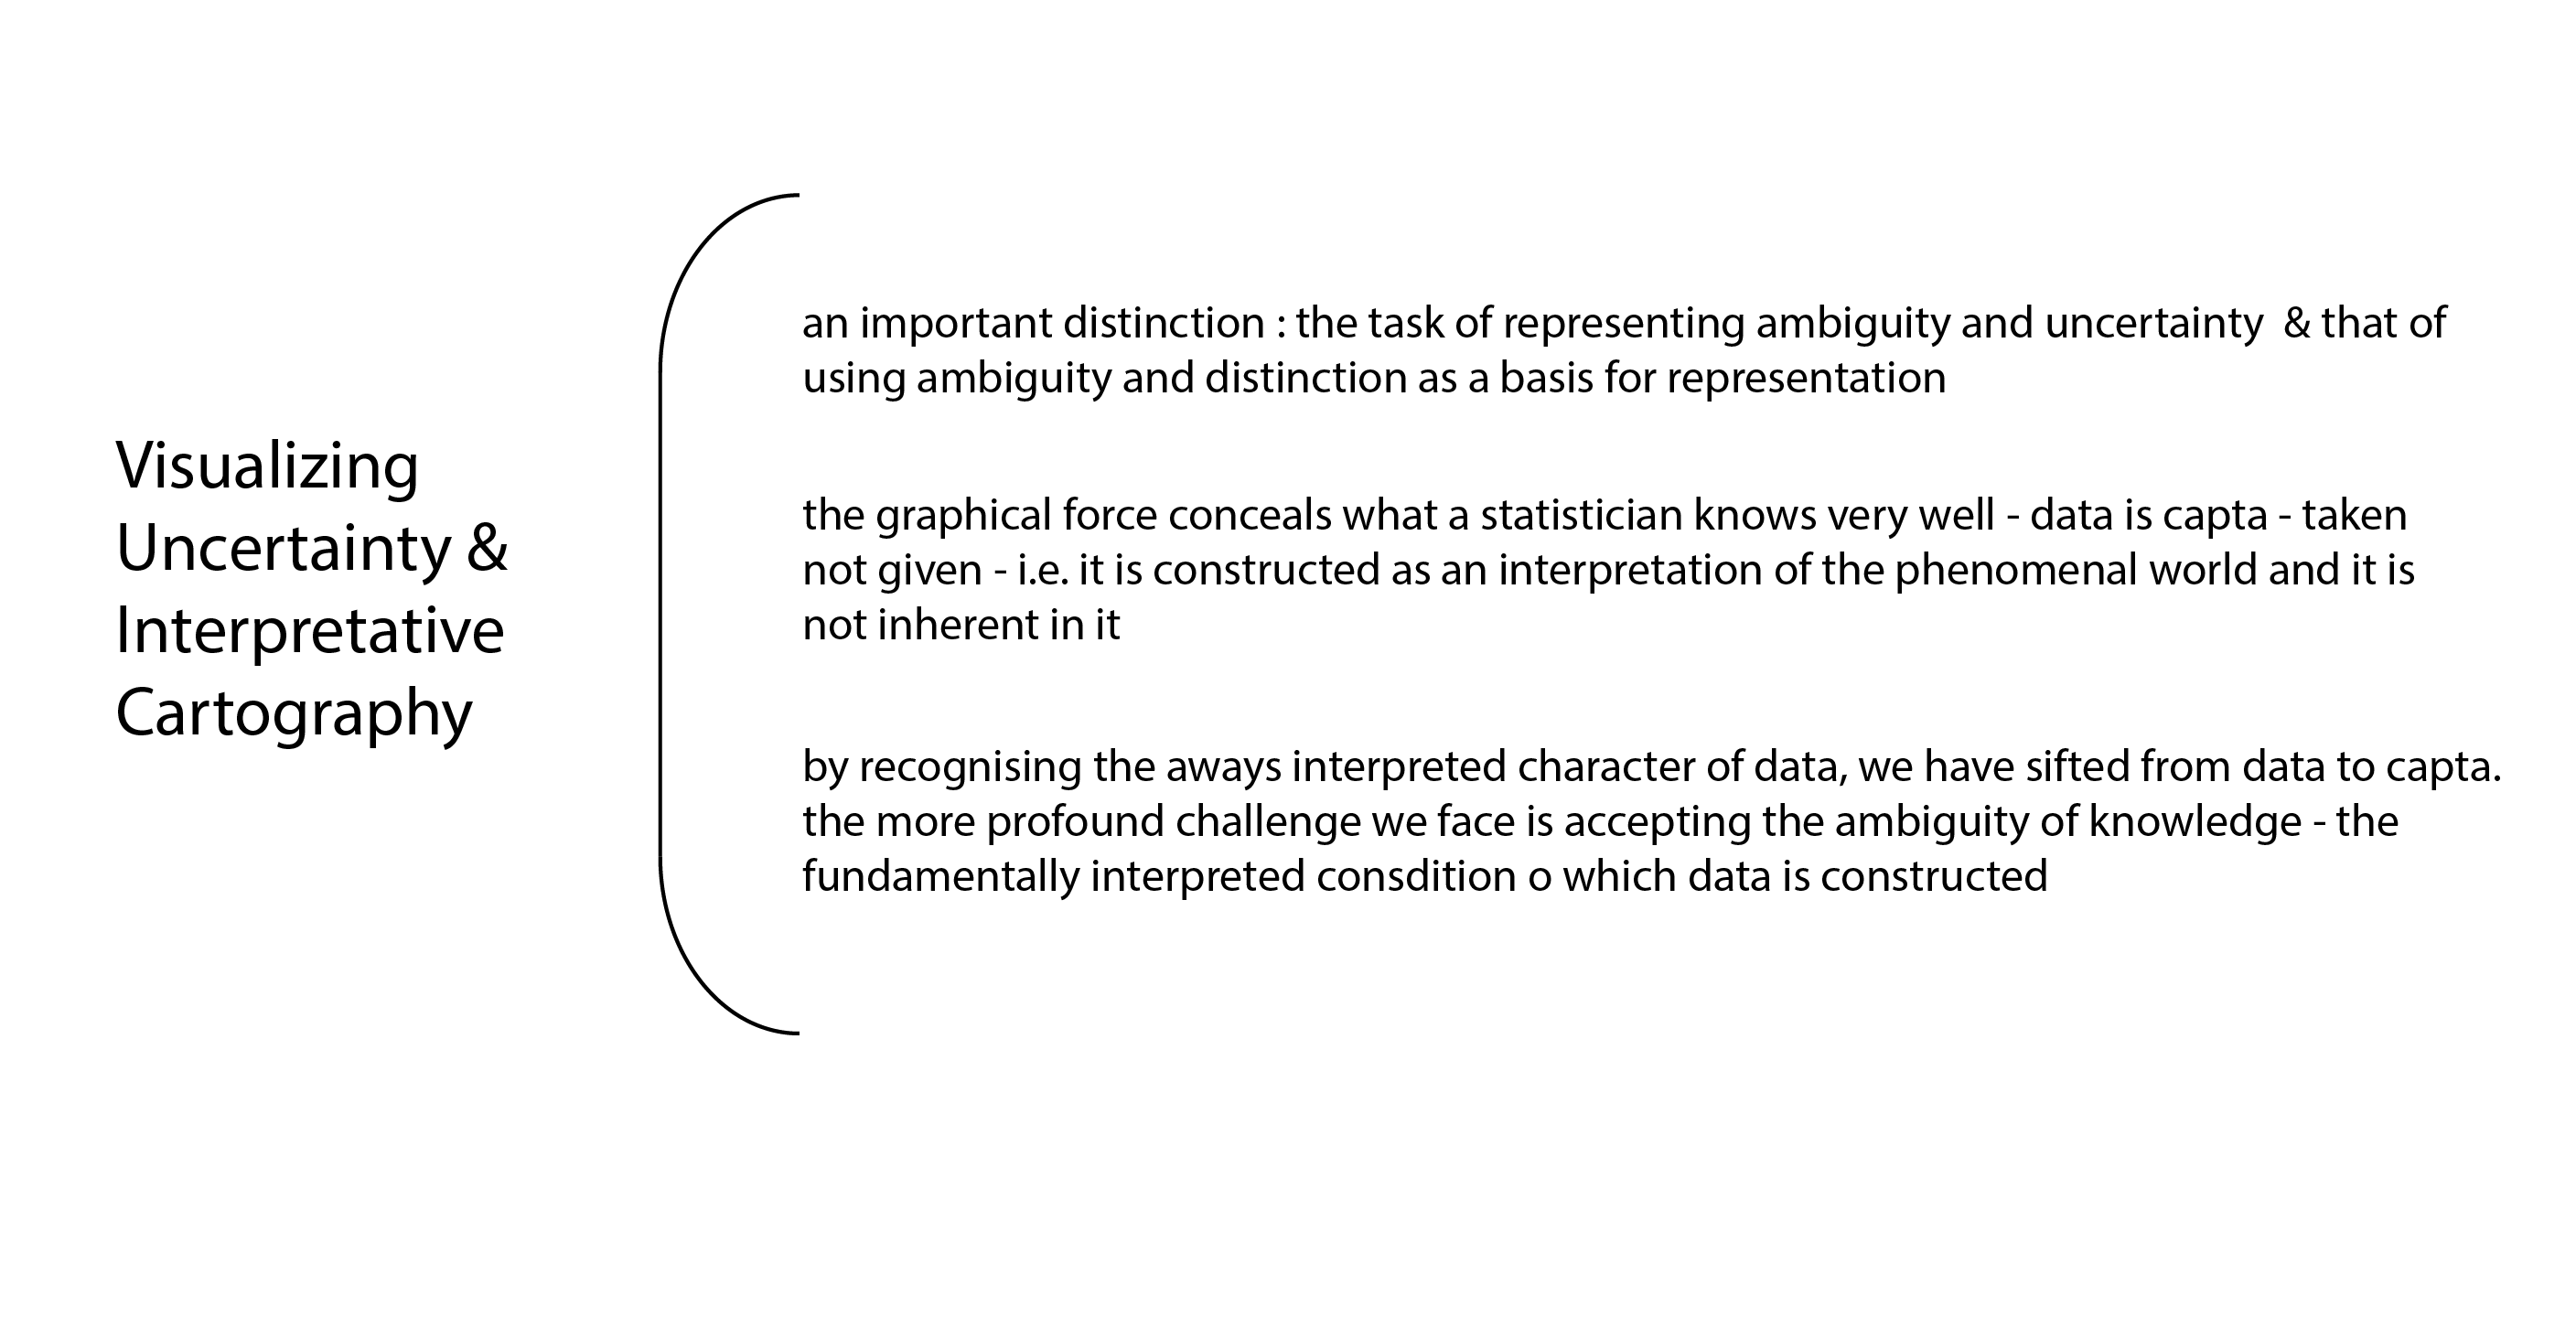
I could not understand this section very well. But my big take away at the moment would be: Data is Capta. Its something that's captured/measures from the real world events (phenomena). Hence data is a construct. A statistician knows this very well but graphical force does not reveal it efficiently.
After reading this section, it felt that there are two major approaches to the interpretations & representations- statistical and humanistic. The former primarily deals with the representation of quantitative data (which is as stated in the reading, a construct taken from the real world with an assumption of objectivity /observer- independent observation) and later with all kinds of subjective considerations.
In chapter 2 of Graphesis, Interpreting Visualization: Visualization Interpretation, Drucker describes many different graphical visualization forms in the history, and classify them into different parameters such as, graphical format, intellectual purpose or function, the type of content they express, the way they structure meaning and their disciplinary origins. She traces those visualization deeply and tries analysis them from the very beginning.
I am very fond of reading the part of "Visualizing uncertainty and interpretative cartography. A huge part of our daily life is filled with uncertainty and ambiguity. But often we get so used to it and don't realize it. Every day we take the subway to school, to work or back home. The charmingly complicated NYC subway map with various color lines is one of the first examples that jump to my mind about the humanistic approach. It is not a precisely "truthful" distance representation, but it is an interpretative representation of the data to convey what people need to know. The author states "the shift away from standard metrics to metrics that express interpretation is an essential move for humanist and/or constructivists across disciplines." Identified as a humanist, I never really thought about or articulate the importance of visualizing interpretation. It is good to keep asking oneself, as a designer, what can I do to serve the purpose of my work better. It goes without saying that our biggest purpose is for human to understand. The author also stresses the difference between representing the uncertainty and ambiguity for humanistic reasons and using the uncertainty and ambiguity to construct a representation to convey a kind of bias. I remember when I was in China, I found that the size of Russia seems inconsistent in different maps. In the map of China, Russia seems just a bit larger than China. But in a world map produced by some other countries, Russia is significantly larger. Political climate has affected cartography long ago. An interesting and confusing observation for me as a young kid.
The insights on knowledge generators are inspiring, especially the paragraphs discussing on the development in mathematic symbols. Having studied math for over 16 years (since 1st grade in elementary school), I have never thought about the nature or the insights of the logical symbols or diagrams that I used every day almost. It is a new perspective for me to consider them as performers of reasoning other than representation of the logics. For example, the Venn diagram cannot describe the information precisely but it can display the interactions clearly.
Similarly, visualizations in other scenarios can act in the same way. Yet the most cases I have encountered are representing existing information, the function of visualization as an approach to create new information is more interesting and important to me. In the former situation, visualization is only a tool to facilitate the address of information; while in the latter circumstance, it becomes a method of exploration and research that brings more value and knowledge. The current adoption of visualization are largely limited to the use of display known information. Sometimes visualization generates new knowledge when they display some unsual features. However, there is seldom a static method of creating new information through visualization, which I believe worth more research and study. It is a more direct and powerful way of information generating due to the essense of its visual form and the large amount of information it could carry via shapes, outlines, colors and so forth.
In chapter 4 of Graphesis, author Johanna Drucker explained what interface is by showing the term's development and theory throughout history. Throughout the chapter, Johanna kept coming back to the idea that in order to understand what interface is, we have to pay attention to the tension between the idea that interface is a restricted canvas that shows different functions of a digital product and the idea that interface is the experience that users have while using it. The former idea derived from the origin of interface, when interface was designed mainly for the purpose of engineer. However, interface studies has becoming more and more human-centered. Psychology and sociology play a big role in shaping interface. And this moved designing interface closer to graphic design or media than just pure engineering.
My first impression of the chapter was even though the writing is very academic and took me a long time to comprehend, I found the chapter very interesting. I am an UX designer so some concepts explained in the chapter for example "affordance", "user experience", or "reading experience" is quite familiar. However, the chapter is not really a guideline but more about explaining these concepts in the context of different works and ideas of different authors throughout the history. It is helpful to look back and see how those concepts evolve in the past few decades.
In term of applying this chapter into data visualization, I think this chapter is really helpful because nowadays, most of data visualization is done and viewed digitally so data visualizers must take into consideration of how viewers will look at those data in the browser in comparison of how people looked at charts on paper in the past.
In the chapter of Graphesis titled “Visualizing Interpretation”, Joanna Drucker continues to draw connections between the disparate origins of data visualization, from the modern calendars’ ancient roots in Babylonia, to its current hybrid uses in digital contexts. The earliest information visualizations are also the conventions of the field, with origins in record keeping, and observation. That may sound like rather dry work, but considering the breadth of “things” that can be observed and monitored (things: medical, herbal, astrological, alchemical, cabalistic practice, anatomy, astronomy, etc.), it allows our field to be inherently multidisciplinary and representative of a more holistic view of our society and environment.
Drucker states that there are two types of visualizations: those that are static representations of well-known information like a bar chart, and those that are knowledge generators - objects that create new information with their use. Throughout the beginning of the chapter, she also outlines the various forms of visualization based on differing parameters, including:
Graphical Format
Intellectual purpose or function
mapping
navigating
record keeping
calculation
The type of content they express
qualitative
spatial
temporal
quantitative
interpretive
The way they structure meaning
analogy
connection
comparison
using nodes/lines
vectors
columns
bi & multi-variate axes
point of view systems, etc.
Disciplinary Origins
bar diagrams from statistics
trees from genealogy
Maps from exploration
flow charts from hierarchy in corporations or electrical circuits
The challenge she’s says, is to “develop a terminology for the rhetorical iconography of graphical forms that is grounded in the features of specialized relations, such as hierarchy, juxtaposition, and proximity.” In other words, there is still no agreed upon set of symbols that can adequately represent uncertainty. The trick is to treat them as complex systems, and to reinterpret the values to include non-linearity which is inherent in the human experience.
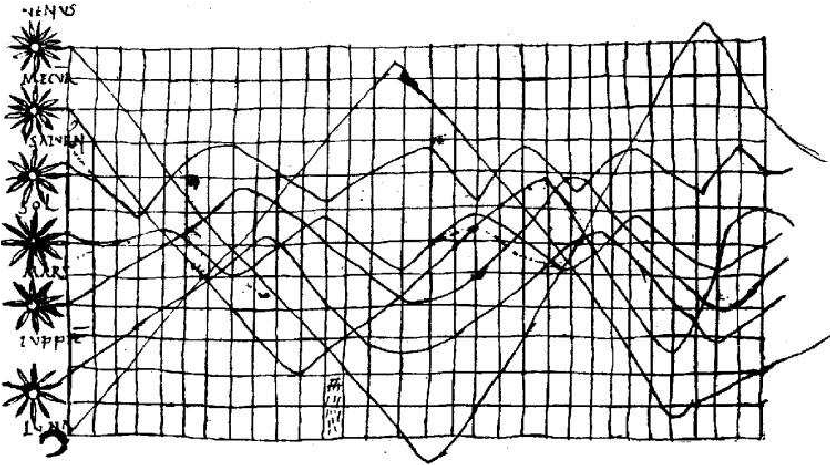
In her treatment on timekeeping she covers a lot of ground, weaving in the history of the earliest available graphs which includes one of my favorite images, the earliest known chart of planetary movements from the 10th century translation of Macrobius’ Commentarii in Somnium Scipionis ("Commentary on the Dream of Scipio”) Macrobius’s commentary included an exploration of the nature of dreams based on the Greek dream-theory of Artemidorus from the second century AD. This is an incredible example of visualizing uncertainty: the natural inclination to graph the observation of the heavens which was referenced in a 10th century essay on dream theory! Interestingly, graph paper as it is commonly known did not appear for some 800 years after this drawing!!
Drucker goes on to discuss visualizing uncertainty and the opportunities for humanistic capta visualization. Phenomenology is the study of the human experience (s) and consciousness. In its most basic form, phenomenology attempts to create conditions for the objective study of topics usually regarded as subjective: consciousness and the “objects” of these experiences such as judgements, perceptions, and emotions. While it seeks to be scientific, phenomenology is not an attempt to study consciousness from the perspective of a psychiatrist, etc. It is a philosophical movement that seeks to determine the essential properties and structures of experience through research. To this end, phenomenologists prefer to gather "capta", or conscious experience, rather than traditional data. Capta represents what is seen, thought and felt. Capta, according to phenomenologists, is the 'data of the conscious experience’.
If All Data is Capta, this means that we have to reconsider everything we think we know. Drucker reminds us that nations, genders, and populations are ambiguous. We need to acknowledge that our borders are porous and we can no longer force people into convenient little boxes. Those boxes are not stable, reliable, 'a priori’ data; they are subject to change and will be interpreted through the reality of lived experience. Drucker states:
“Data pass themselves off as mere descriptions of a priori conditions. Rendering observation as if it were the same as the phenomena observed, collapses the critical distance between the phenomenal world and its interpretation, undoing the concept of interpretation on which humanistic knowledge production is based. We know this. But we seem ready and eager to suspend critical judgment in a rush to visualization. At the very least, humanists beginning to play at the intersection of statistics and graphics ought to take a detour through the substantial discussions of the sociology of knowledge and its critical discussion of realist models of data gathering. At best, we need to take on the challenge of developing graphical expressions rooted in and appropriate to interpretive activity.” (p. 126)
Drucker is strongly encouraging us to reconsider our role as visualizers in order to embrace a humanistic approach - recognizing the interpretive nature of knowledge. She asks us to lean into the expression of ambiguity as we integrate human experience into data reproduction. She encourages this even if it ruffles the feathers of data visualization purists (I imagine Edward Tufte had some tough words for her), so clearly this is an urgent matter.
Personally, I love that she challenges us to accept the human element in data collection and within the interpretation and expression of data. She understands that doing this undercuts the very notion that data is = a stable, unchangeable fact. And as one of those pesky people with a million intersectional identities and a penchant for deconstruction, this call to arms (so-to-speak) is a breath of fresh air.