A Tree is largely used to show ordered data by connecting lines between those points akin to the branches of a tree. In slight contrast to tree maps, Tree Graphs are a collection of nodes that eliminate the need to display hierarchy when it isn't relevant factor to the data's narrative. Some terminology that is commonly used with these visualizations include: Root, Child, Leaf, Generation, Parent, Siblings, Branch, etc. Technically trees are graphs (and families). So what's the difference?
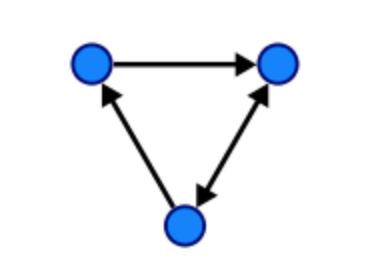
Graphs
Graphs are trees that include a set of nodes and "edges" which act as links between the nodes. In graphs the nodes can connect back to itself which is a pretty handy tool when algorithms are needed to solve problems online, in business and of course, mathematics.
Tree Graph Examples:
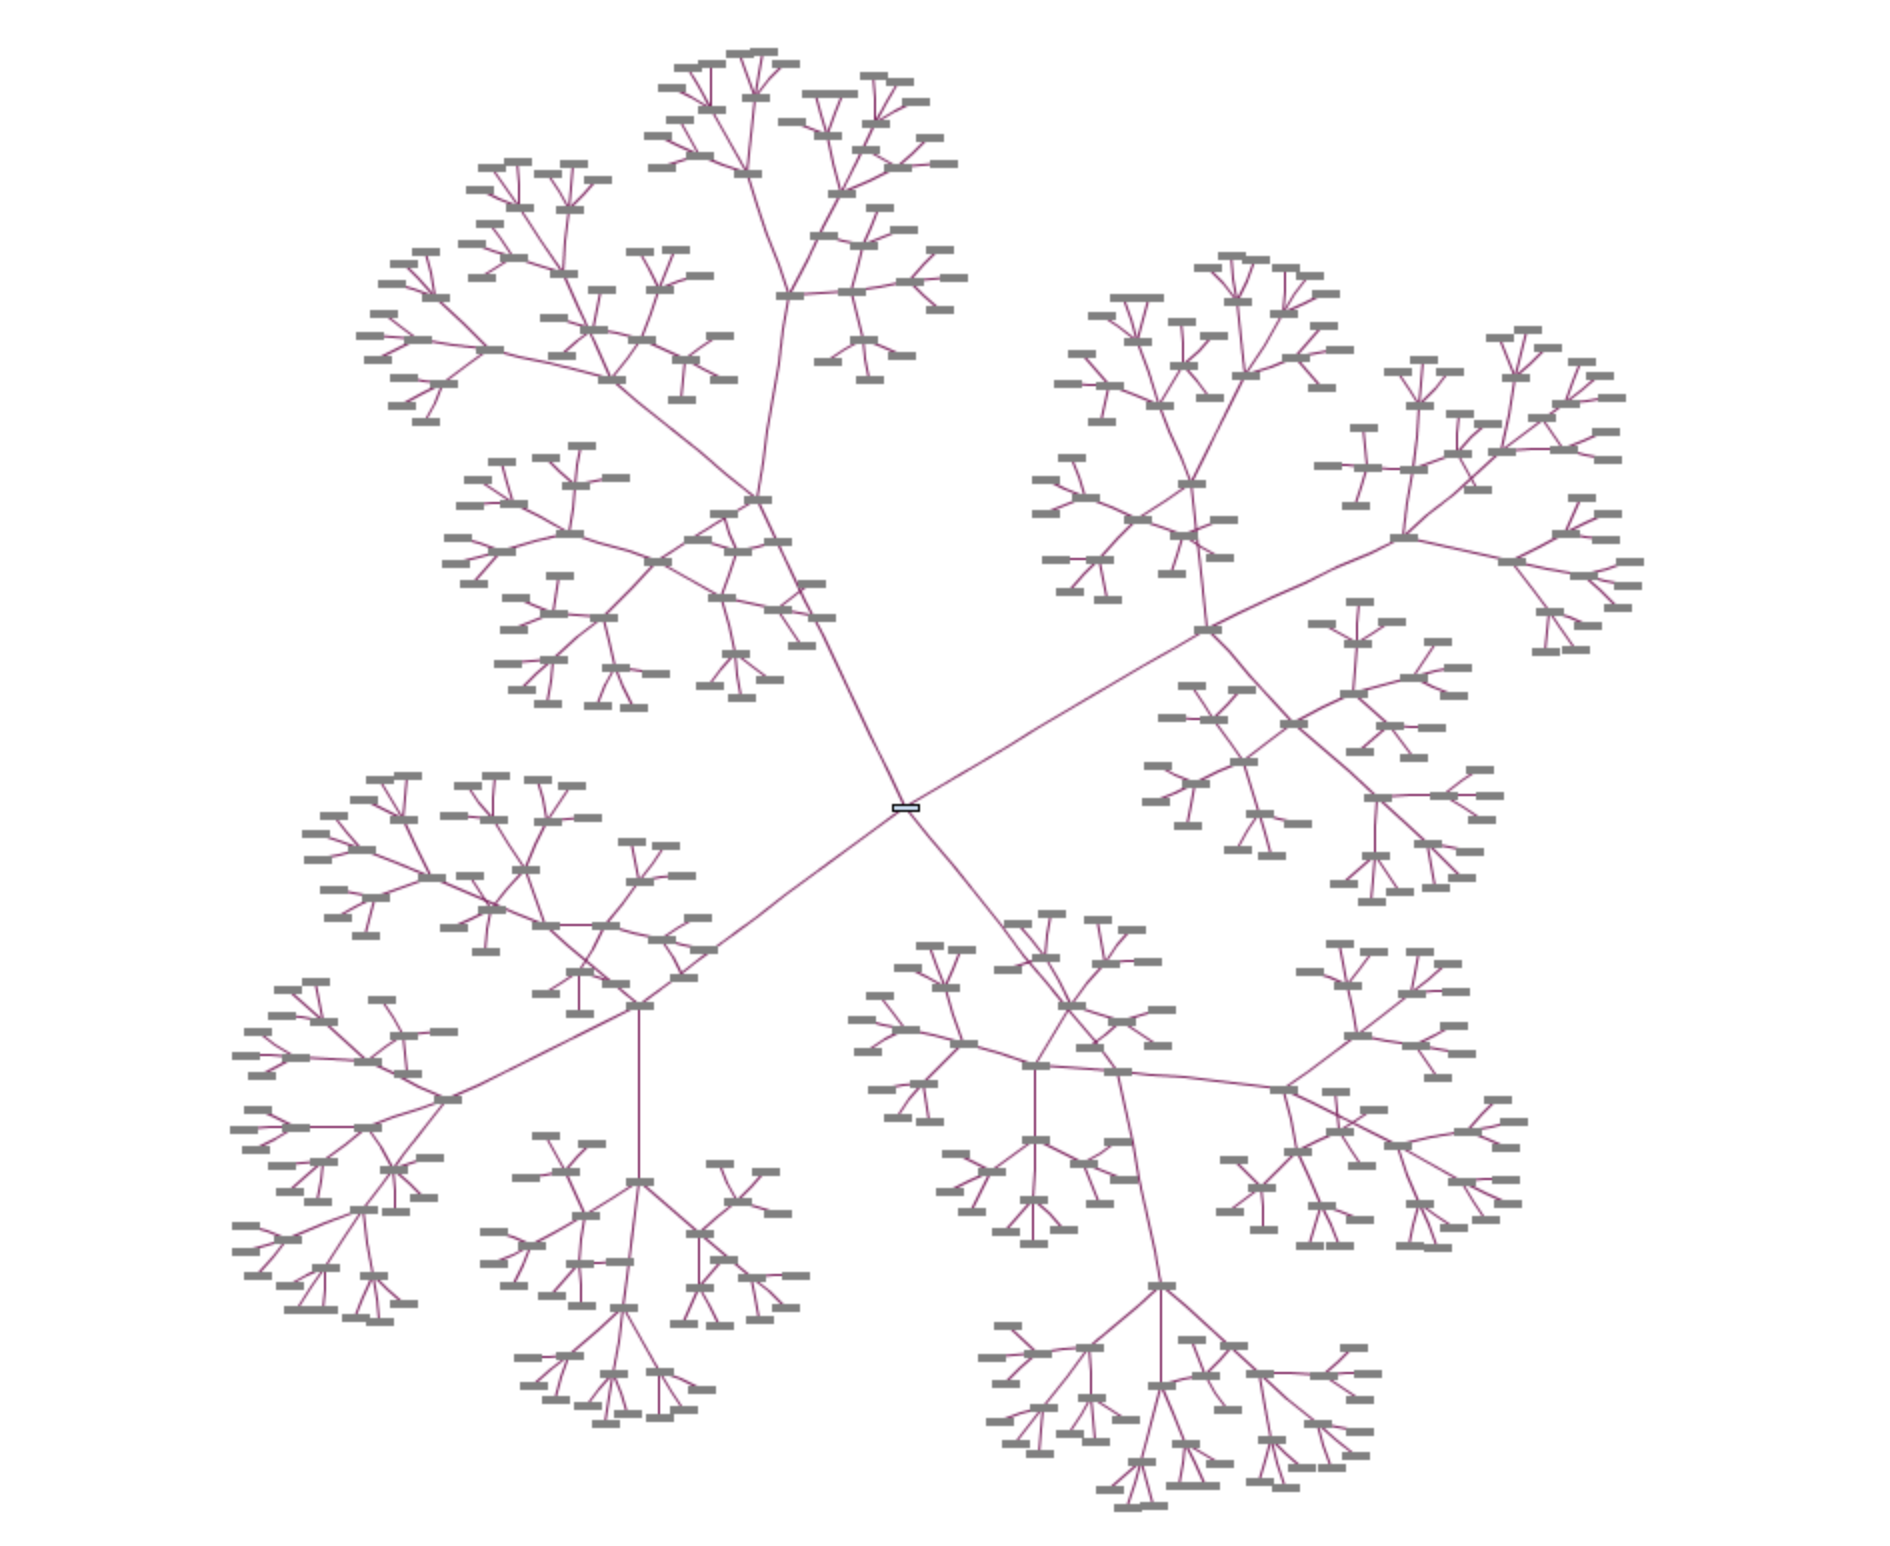
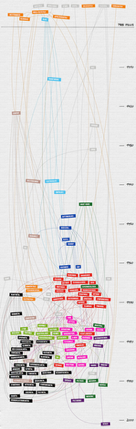
"Generating several different topic trees after one another causes tree topics to superposition. For example, generating a tree with depth 3 and number of child nodes 5 after previous generation results a graph" (Source: http://www.wandora.org/wiki/Tree_graph_generator)
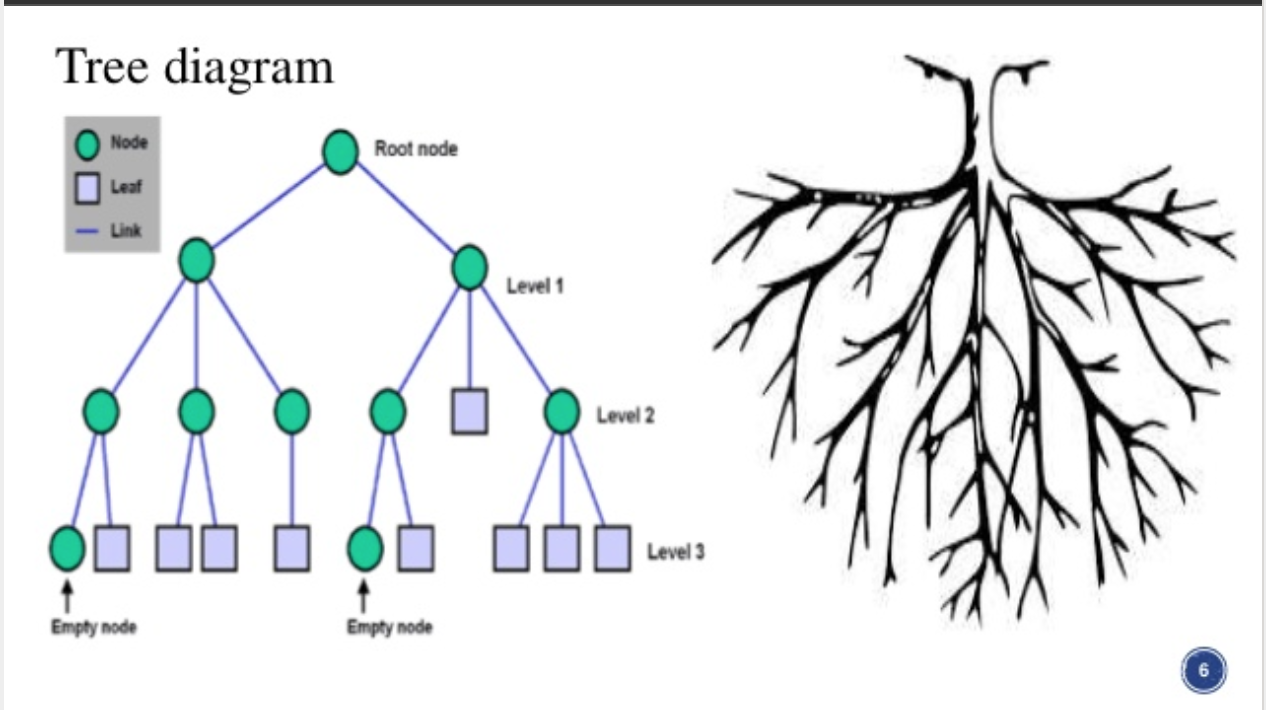
Trees
There are a number of values that this genre of visualization tends to illustrate best, including hierarchy, genealogy, classification, relationships, and organization. The "family" descriptors mentioned above are also used within the organizational structure and logic of computers, discreet mathematics, HTML, and other programming languages.
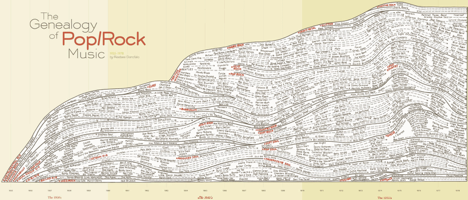
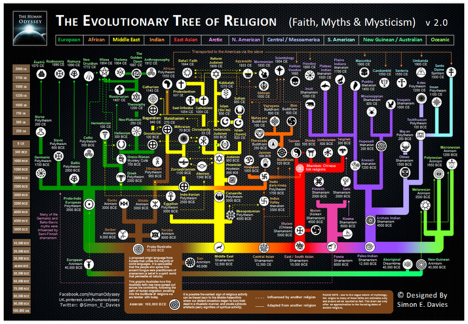
Tree Examples (for you Rock music enthusiasts):
However, there are certainly instances where it is unclear where hierarchy exists. In the example below you can see the organizational chart from the non-profit where I work. I've been an employee for over five years and I still find this graphic to be unwieldy in it's application. In fact, there isn't enough space in this image to place the continued variety of data that exists about front-line employees; their names and titles have been eliminated for efficiency, at the expense of accuracy and the erasure of information. (Photo deleted on 10/27 for privacy concerns)
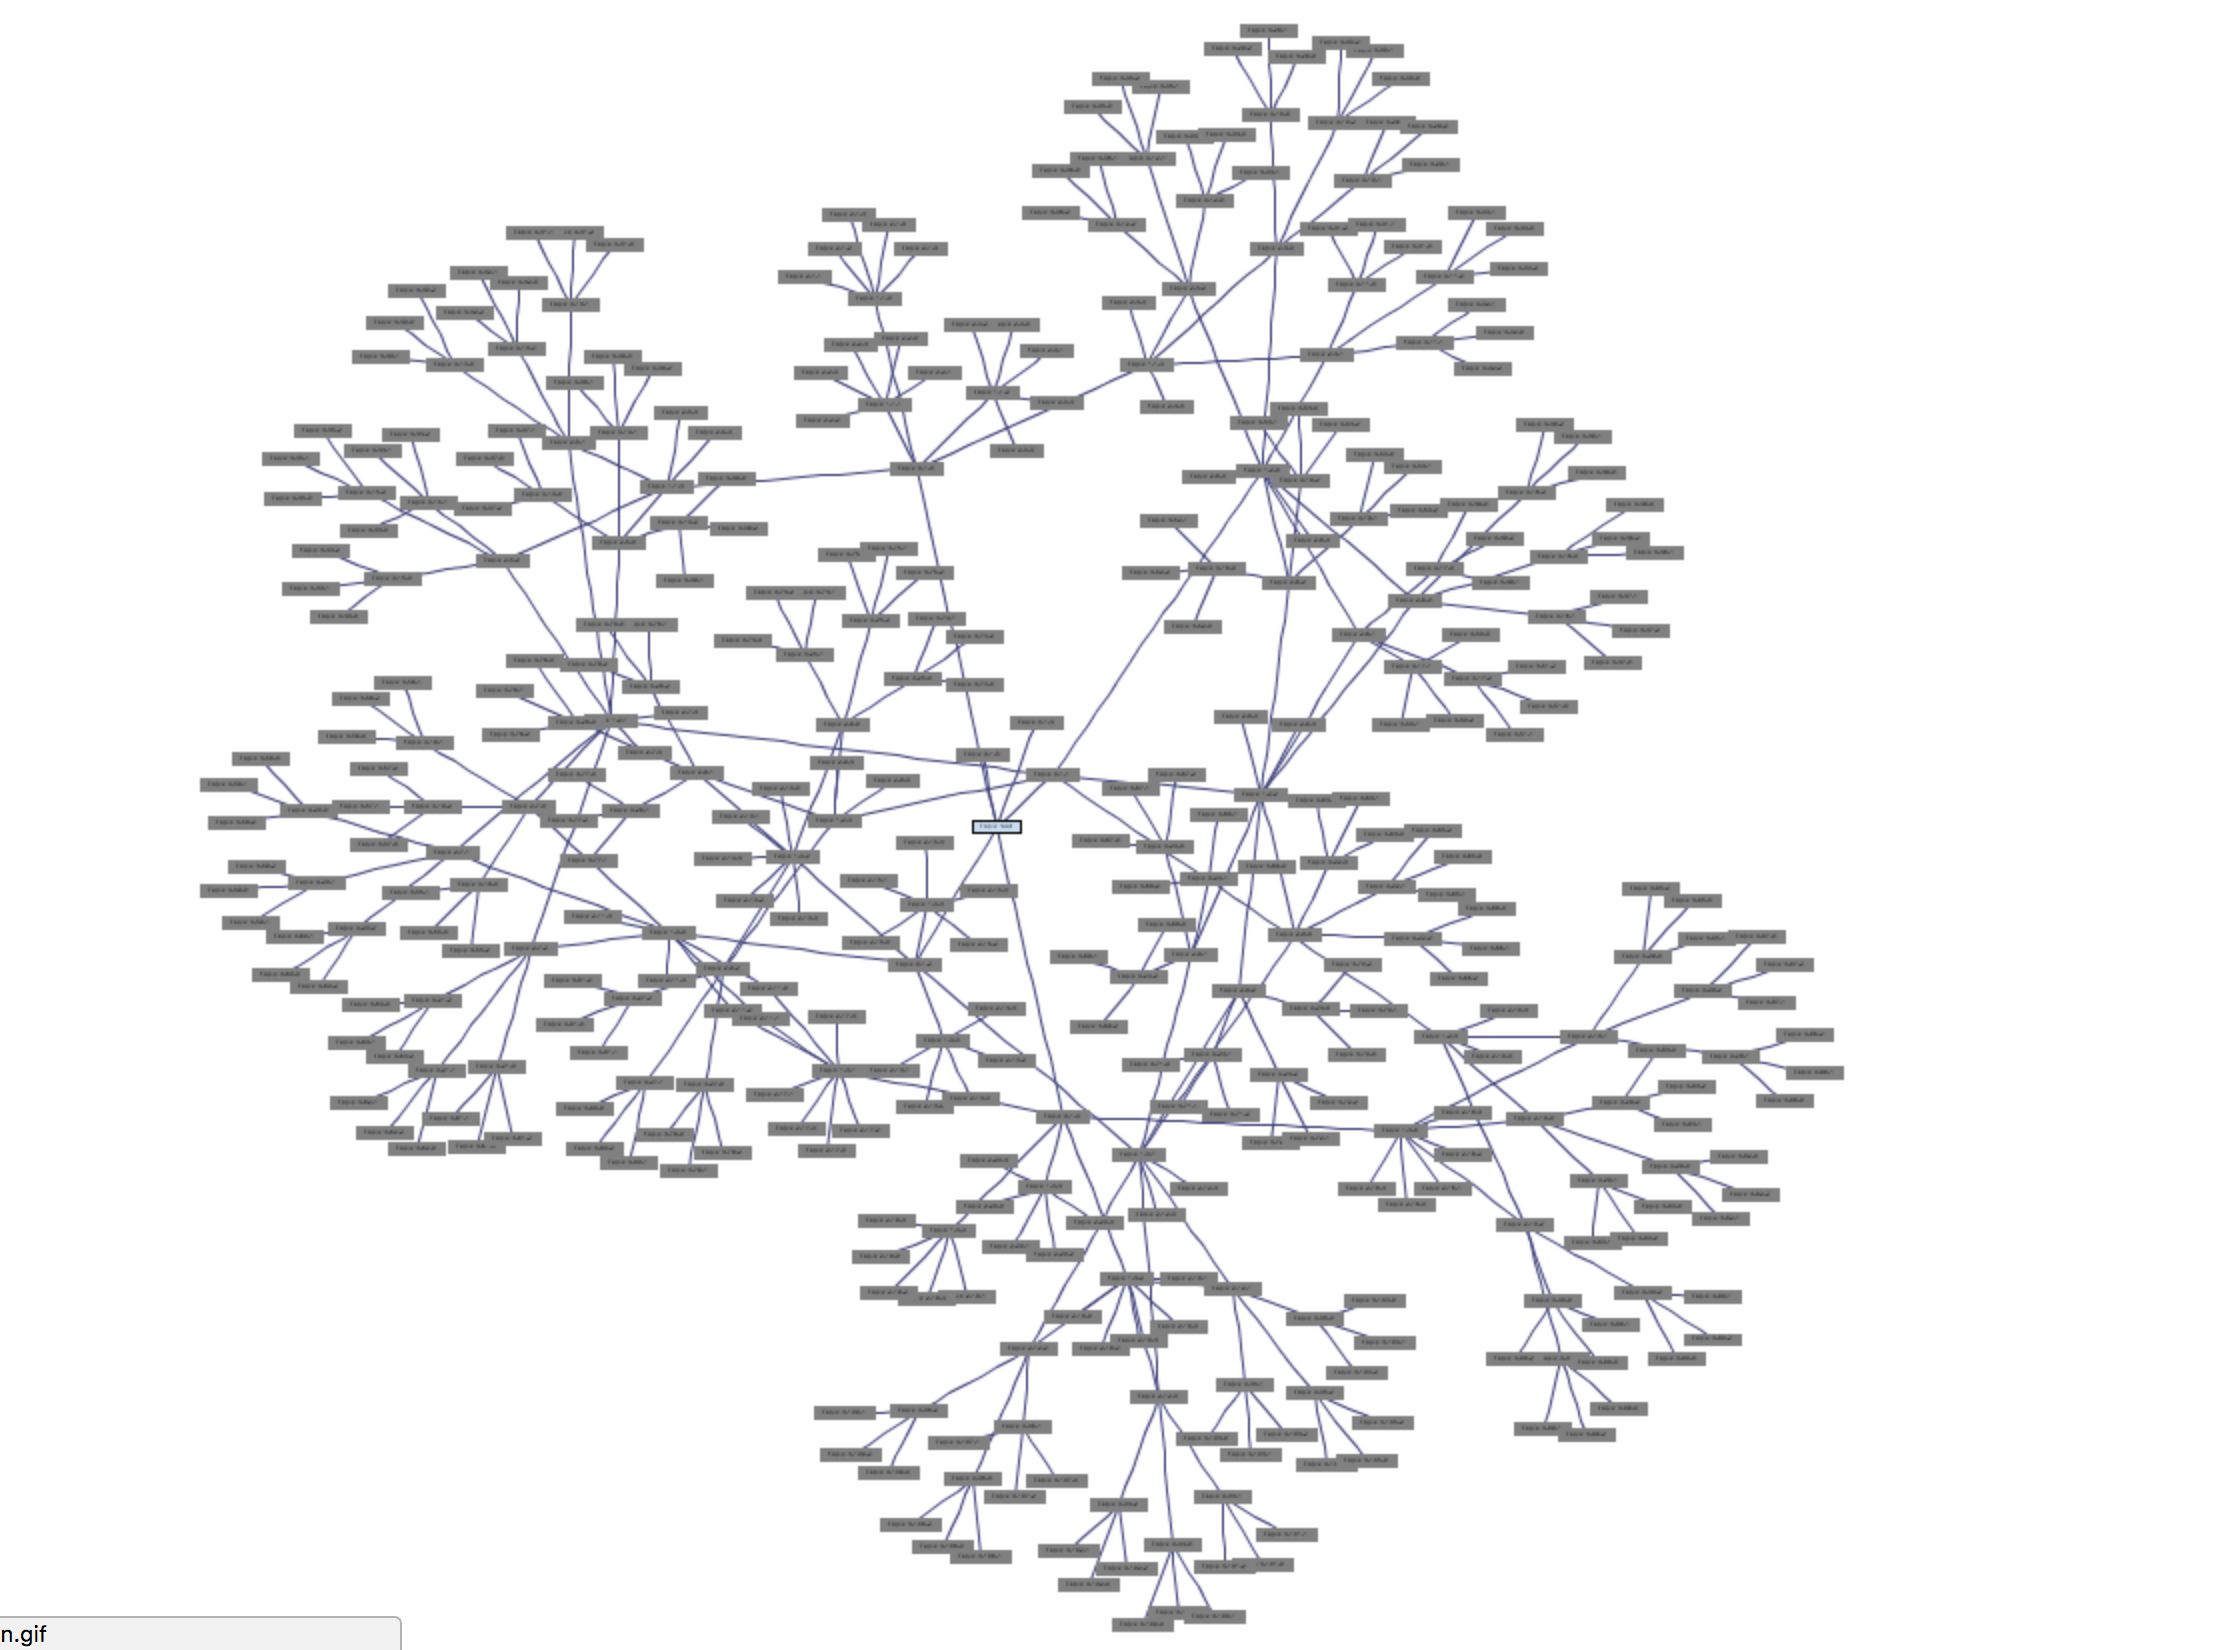
Pre-Processing
When considering using this type of graphic, you have to figure out the key question that requires visualization and the kind of data you would like to display. It is clear that information that can display hierarchy and lineage works best with Trees, where as Graphs are more useful when limitations aren't your jam and you need to process a repeated action or send the direction of data in multiple directions, rather than through a top-down hierarchy. The use of bright colors tend to lend well to comprehending the structure and information contained within Trees. In contrast, the use of monotone colors makes it incredibly difficult to find specific data points within the lineage. Additionally, the Trees that use similar shapes, and typefaces are far more difficult to manage visually and therefore conceptually; regardless of the top-down simplicity of the information flow.