Graphesis is the study of the visual production of knowledge. The front matter first defines some key vocabulary to help readers with the book interpretations: (1) “Information graphics are visualizations based on abstractions of statistical data. All information visualizations are metrics expressed as graphics. Visualizations are always interpretations—data does not have an inherent visual form that merely gives rise to a graphic expression.” (2) “Visual epistemology refers to ways of knowing that are presented and processed visually, though in this book I only pay attention to representations, not to cognition. Visual expressions of knowledge are integral to many disciplines in the natural sciences, but language-oriented humanities traditions have only barely engaged with visual forms of knowledge.” (3) “The phrase “language of form” suggests a systematic approach to graphic expression as a means as well as an object of study. The long history of codifying knowledge in visual forms contains a rich inventory of examples on which to construct a fundamental understanding of graphics as systematic expressions of knowledge.”
The author’s approach in the book are as follows:
• Knowledge and/as vision: the ways visual ordering and classification serve intellectual work, particularly with respect to issues of interpretation;
• Languages of form: the formal systems in which visual forms have been classified and characterized;
• Dynamics of form/universal principles of design: the extension of the “languages” metaphor to universal and dynamic systems;
• Gestalt principles and tendencies: the principles of perception that locate visual knowledge in psychology and human experience;
• Basic variables: the contributions of the semiotics of graphics;
• Understanding graphics and editing: techniques of framing and reading;
• Processing images: basic issues in computational vision; and finally,
• Typology of graphic forms presents ways of classifying graphic images in current use for humanistic projects.
The author references visual historical pieces. Drucker emphasizes that visualization is an extremely powerful and important data representation that has historically been marginalized. For example, Drucker referenced, “The mathematician René Thom once stated unequivocally that knowledge could only be communicated using one of two modes of expression: mathematical notation and written language.12 He deliberately excluded graphical means as unreliable. Visual codes are notoriously unstable, too imprecise to communicate knowledge with certainty. .. But Thom overlooked the ways graphical representation has encoded and communicated knowledge for centuries. Systematic uses of visual images have created standards and consensus across a wide variety of disciplines that depend on visual observation and analysis.13 Architecture provides a particularly useful example of this since analogies with language as a formal system were central to description and analysis of building styles from late antiquity.”
Jesse James Garrett, Elements of the User Experience (2000)
http://www.jjg.net/elements/pdf/elements.pdf
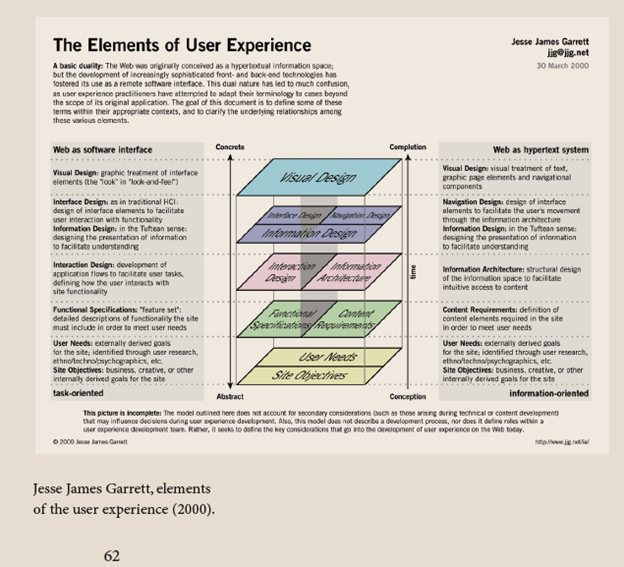
The above diagram (Graphesis, p. 62) was the result of a new job Jesse James Garrett begun. As he was working internally (i.e. within himself) to define some of the functionalities of his new job, he developed the above diagram which led to the book, “Garrett, Jesse James. The Elements of User Experience: User-Centered Design for the Web and Beyond (2nd Edition).” which is an eight-chapter. In his book he states, “Eventually I started hearing from people all over the world about how they had used the diagram to educate their co-workers and to give their organizations a common vocabulary for discussing these issues. … In the year after it was first released, “The Elements of User Experience” was downloaded from my site more than 20,000 times. I began to hear about how it was being used in large organizations and tiny Web development groups to help them work and communicate more effectively.” The book is loosely organized around the details for describing the graphic above.