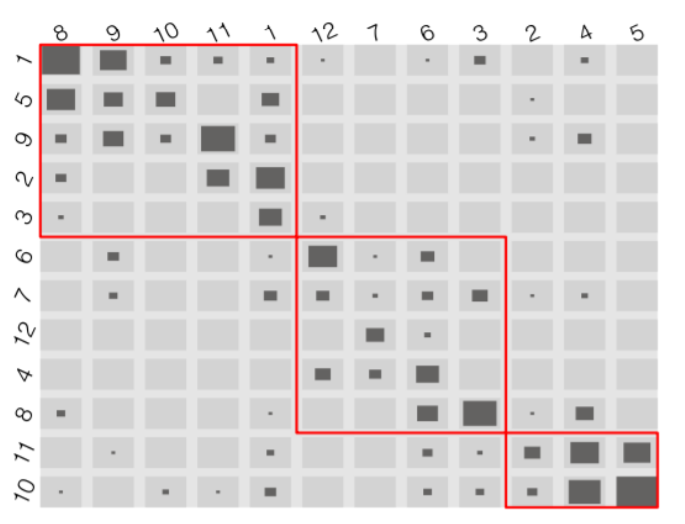
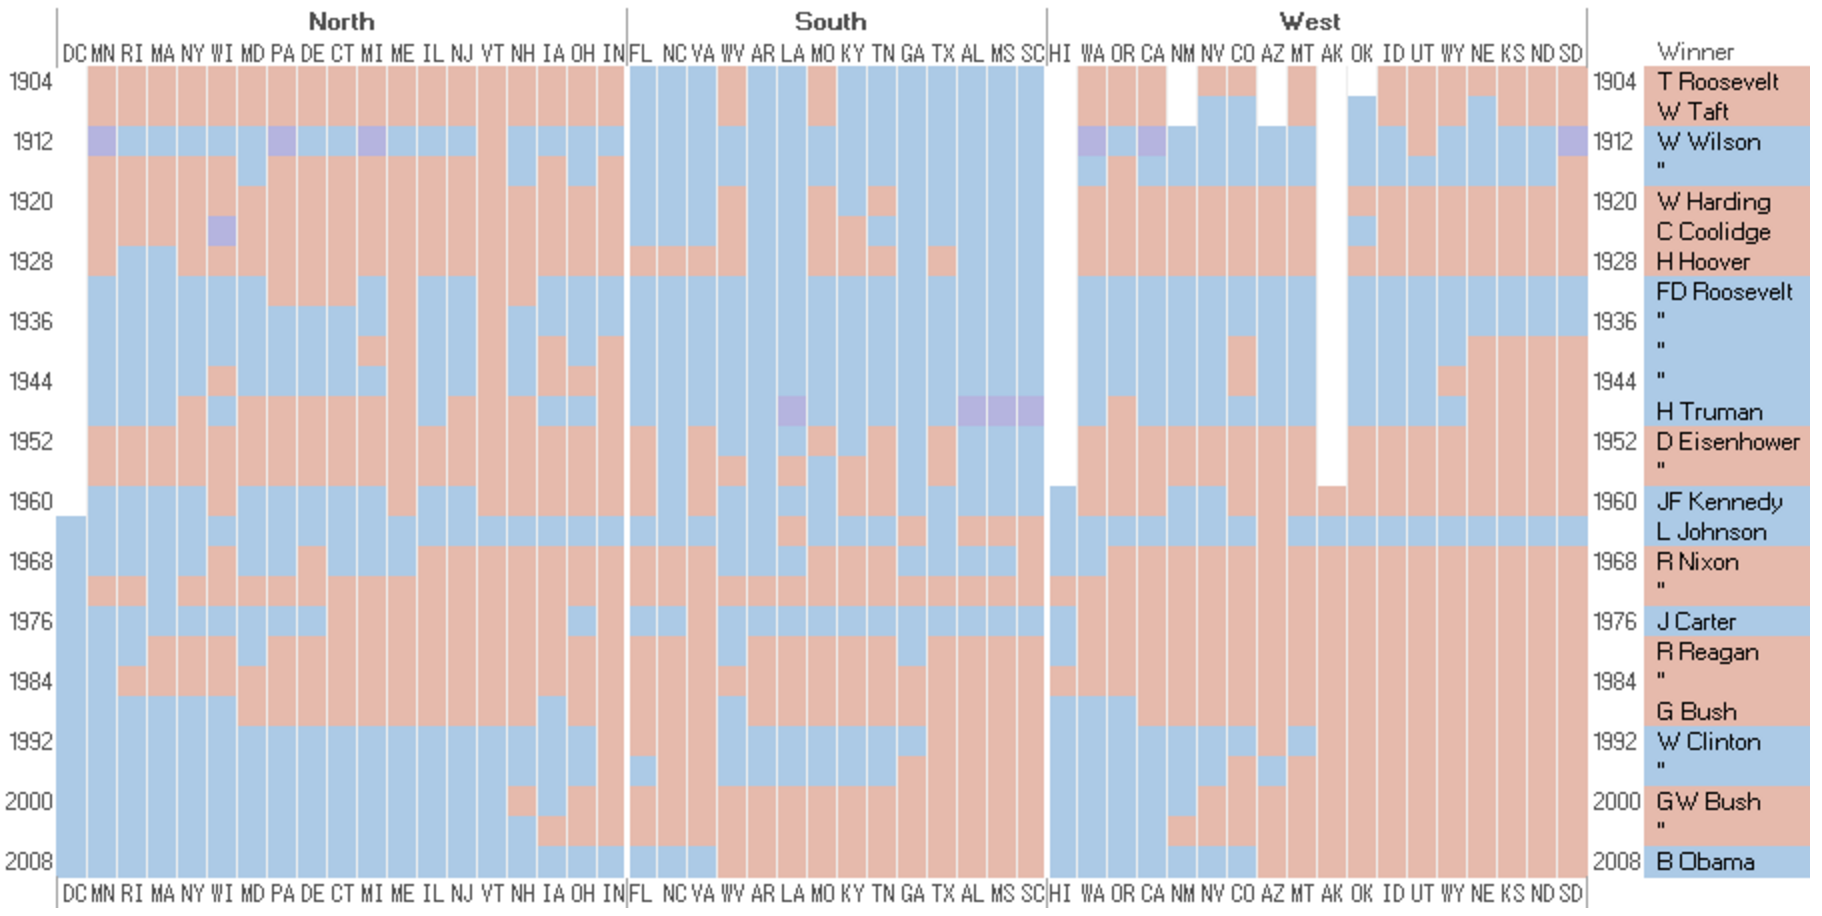
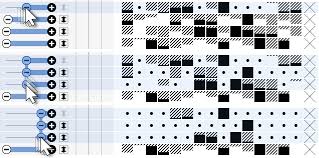
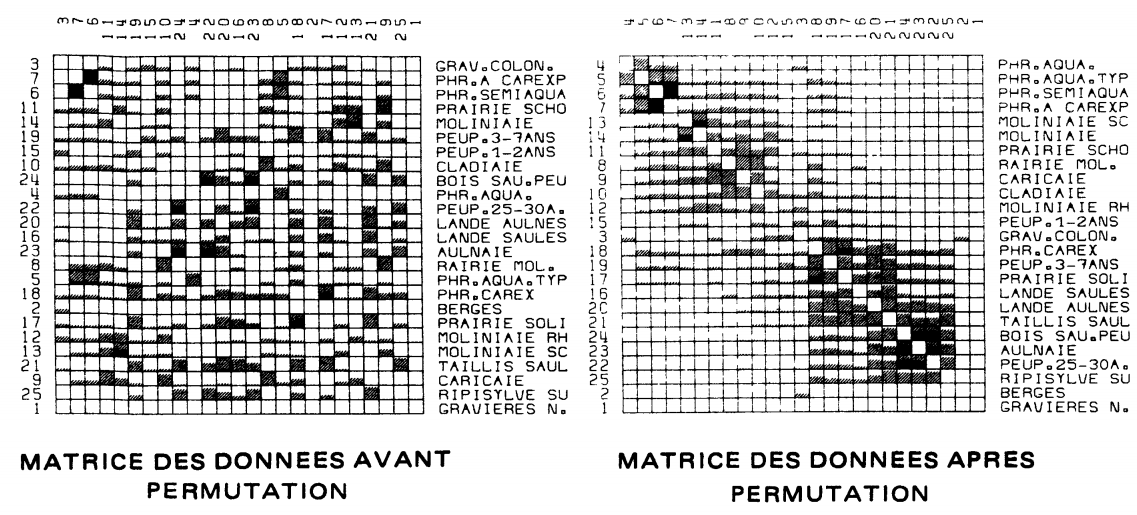
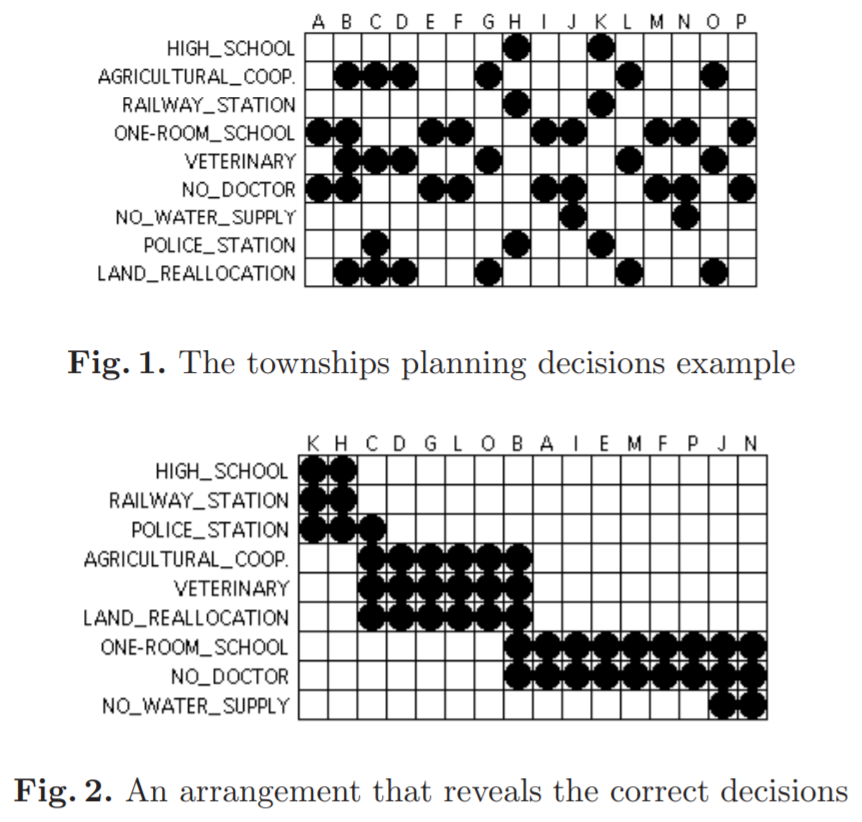
Permutation matrices are sortable charts used to explore patterns and correlations in multi-dimensional re-orderable data.
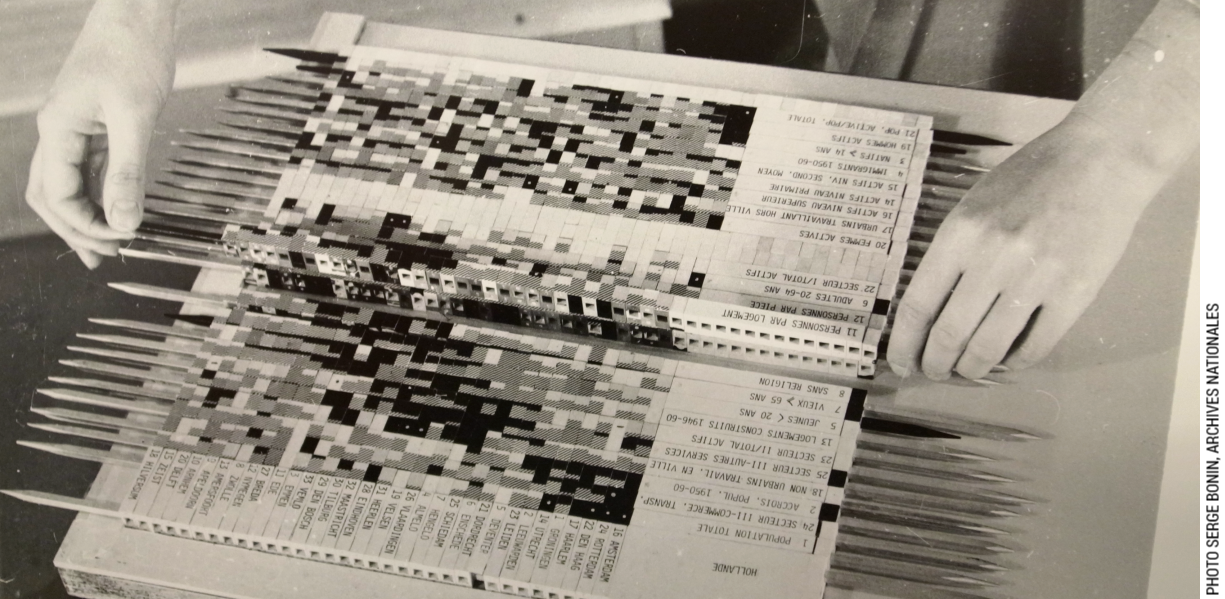
Jacques Bertin knew that interaction is at the heart of exploring hidden relationships in data. Before modern computers existed, Bertin constructed physical wooden matrices (called "Dominos") to explore data. The re-orderable matrices were made through collecting data and encoding it for different ranges, firstly on paper, then on wood. The matrix was then assembled and reordered with a laborious manual method to reveal patterns and groups. Photographs of the results were then used in scientific publications. (see here)
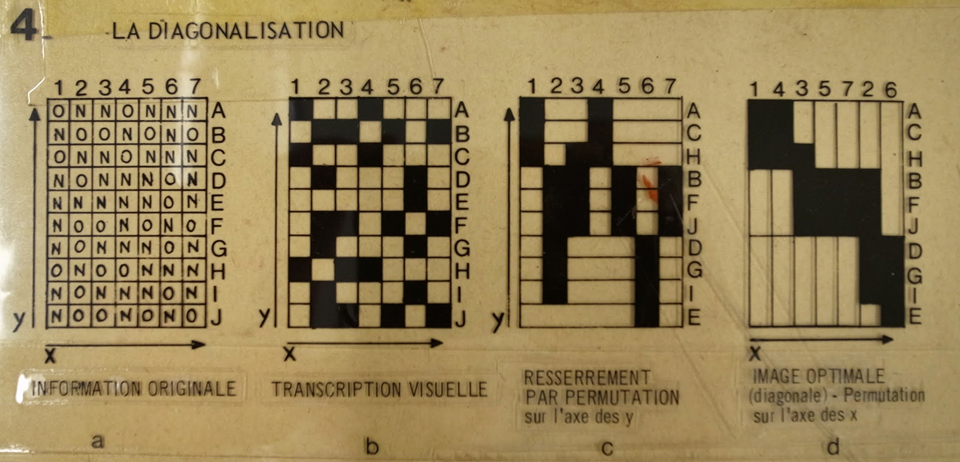
Suitable data sets included variables that do not rely on order; i.e. data that isn't sequential. The method of using permutation matrices consist of converting raw numerical data into appropriate ranges and then associating each of these ranges to corresponding identifying shapes, sizes and/or colour mappings; for example numerical data is mapped to different different sizes of circles or squares and hues of colour. The most optimal mapping is for "true" or "false" variables, where a matrix cell is "white" for "false" and "black" for "true" (or vice versa).
Each of the identifiers are then placed into a matrix that is sorted and/or grouped into categories of cells with visual likeness, which effectively groups data that has corresponding ranges.
Below is given some examples of good implementations of the method:
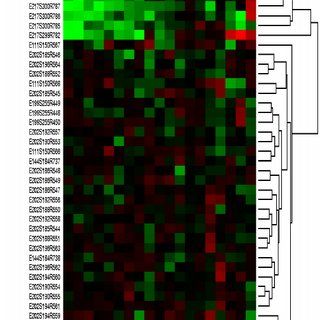
Below is given some implementations that shows the limitations of the method.