The use of color to display data is a solved problem, right? Just pick a palette from a drop-down menu (probably either a grayscale ramp or a rainbow), set start and end points, press “apply,” and you’re done. Although we all know it’s not that simple, that’s often how colors are chosen in the real world. As a result, many visualizations fail to represent the underlying data as well as they could.
Read the blog series and optionally also watch the lecture.
Use the tag “R2” when you post your assessment of the readings and the questions raised.
Robert Simmon is the lead visualizer for the Nasa Earth Observatory and has an extensive background in using colour as a representation tool. After watching his talk from the 2014 Open Vis Conference, I gained great insight into how colour can be used of data visualization.
Simmon says, “The purpose of data visualization is to illuminate the data. To show patterns and relationships that are otherwise hidden in an impenetrable mass of numbers...colour for spatial or multi-dimensional data, is one of the most effective and common ways to conveying this information" (3:27 - 4:07). I find this quote powerful as it breaks down the goal of data visualization and how colour can be used as a tool.
Diving into basic colour theory, Simmon's addresses how we perceive colour vs. how colour is computed. He suggests that we move into thinking about colour in terms of lightness, hue and saturation, particularly using the LCH colour space (not the HSB scale). He then discusses how colour palettes using LCH, can impact sequential data, divergent data and qualitative data. In qualitative data, the goal is to make your colours choices as distinct as possible to separate the classes. However, he shows a 12-class palette. He notes that this is not ideal, alluding to Bertin’s theory of the ‘rule of 7’. Beyond this he states that you can use intuitive or semantically associated colours.
I found this talk very informative, particularly this distaste for ‘the rainbow palette’. Do you think this point against the rainbow palette is valid? How can we incorporate some of his principles into our own work?
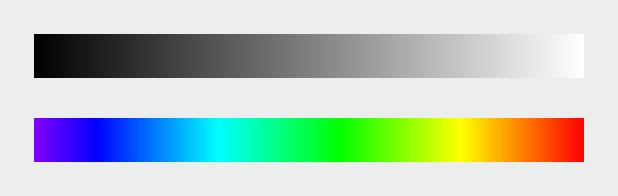
Okay. I think this is time for me to have a little self reflection. I confess. I often habitually use digital tools without really thinking about what is happening behind the scenes. For instance, I rarely put a thought into what the difference is between desaturation and grayscale, since the results of two look somewhat similar. But they are two different processes yielding varying results. Working in the media art and now studying data viz, I feel a need to build a better understanding of the theoretical background of various data processing techniques and be aware of the gap between human perception and computational processing. Subtleties of Color, the article and talk by Robert Simmon, gave me a good theoretical ground to reach this end.
Simply put, humans are not computers! According to Simmon, human perception is non-linear and uneven, governed by the physiological and environmental limit. We perceive light exponentially as opposed to the linear way of a computer. We are more sensitive to changes at low light levels, and the range of colors perceived by us is uneven. For example, 255 green in the RGB scale looks much brighter to human eyes than 255 blue.This is why numerical color mapping in codes do not always deliver the perceptual uniformity in values and why we are recommended to use certain color palettes to better represent differences in data.
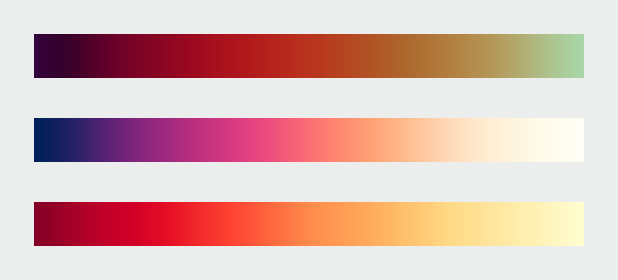
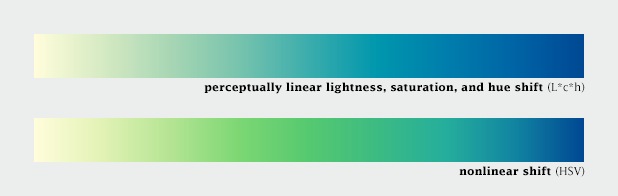
Another interesting fact Simmon delivers is that human visual system is largely driven by lightness. As a good compromise, Simmon suggests combining a linear and continuous change in lightness with a shift in hue. This way, we add a lightness gradient to a change in hue and saturation, get perceptual linearity of a grayscale palette and achieve discrimination from the color component.
Simmon also addresses on designing visualization for color blind people in mind. A substantial portion of people have color deficient vision (8% of male population and 0.5% of female population), and it is only reasonable to use color palettes that can work for everyone. This inevitably leads me to think about a wider range of adaptive design approaches we should consider. In order to reach out to people with different types of disabilities and perceptual limit, we will have to adequately include other reasonable ways in our data “visualization”, such as tactile representation and sonification of data.
Side Note 1: I am happy to once again be confirmed that data visualization is innately multi-disciplinary, where we combine knowledge from many different areas in order to convey the underlying data adequately. It is fascinating that a lot of learning can be done by studying works of cartographers, artists, scientists, visualizers and specialists in the subject of interest, who have accumulated wisdom and honed crafts many years before the widespread use of computers or computational power.
Side Note 2: Robert Simmon's content was largely complementary to Healy’s comment on using already defined color spaces, which I found rather naive in last reading assignment (Link).
The subtleties of colour is both insightful and intriguing. It is amazing to consider the vast amount of resources that are linked to this series of blog posts and the knowledge base to draw from, not to mention the many tools that are available; which are most definitely worth bookmarking.
The reference to the existence of the International Commission on Illumination (CIE) is a welcome inclusion into the series of resources, which illustrates the level of formal background behind the post.
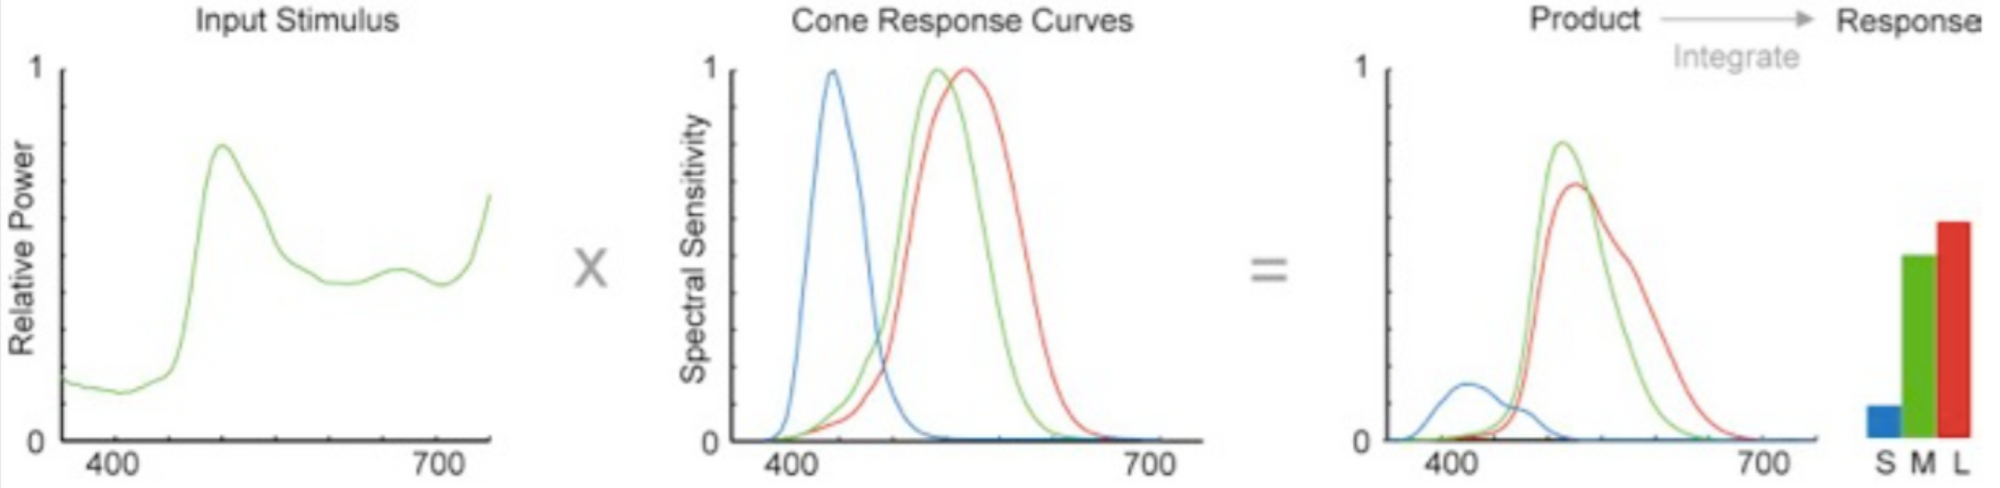
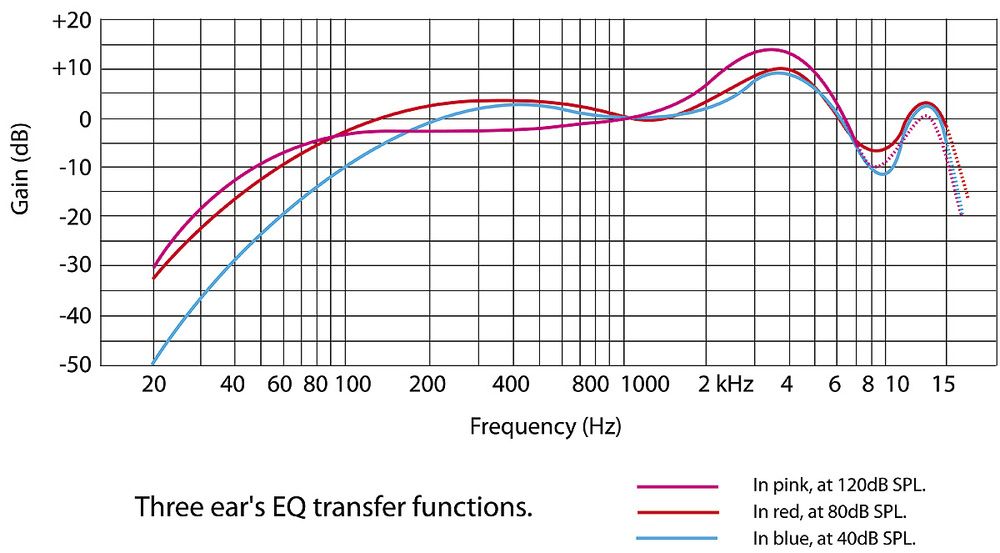
The explanation of the human eye colour frequency (wavelength) response is extremely helpful to understand human colour perception in a way that makes the author’s aversion to the “rainbow spectrum” understandable. A reference from the book by Maureen Stone (see below) amplifies this illustration and makes me wonder if modelling AI and Computer vision would have to include modelling these types of shifts in perspective, and reminds me of the human ear response, that has similar effects on how humans perceive sound.
A field guide to Digital Color, Maureen StoneFrequency Response of the Human ear
The author makes a very strong case for using the CIE LCH model to generate palettes, although it seems sad that computer colours aren’t optimized for expression in this format.
The knowledge to create pallets which are primarily scaled by “lightness” (and then chroma and hue) is a very welcome insight to have. It seems that the effort to convert these pallets to standard RGB values might be a contributing factor to the reason many people just “pick a pallet”. The author mentioned work on an all-encompassing tool to incorporate all the different aspects of the various colour tools into one, which would be a very attractive tool to have.
After reading the diaries of Albert H. Munsell, discovering that the word “blue” was absent in all of Homer’s descriptions of the sea in The Iliad and The Odyssey, and surrendering to the superior visual system of the Mantis shrimp, I finally found my ground in the color literacy lessons of Simmon’s Subtleties of Color.
Simmon was articulate in communicating the importance of using color properly in visualizations. He makes a distinction of seeing color versus thinking about color. Though one of the foundational points was using CIE L*C*h color space of hue, saturation (or chroma), and lightness, as opposed to the more computational model of Red, Green, and Blue (RGB), it was much more nuanced than using a single tool. Beyond abandoning the rainbow palette, and the lack of clarity it provides to viewers (especially around creating artificial boundaries due to the striations of hue), we have different types of data to manage. Each one, whether sequential, divergent, or qualitative, requires a specific color approach.
In his summary, Simmon mentions lightness being the “strongest” variable in the hue, saturation, and lightness triad. This was interesting because not only do humans have an average of 92 million rods on the retina, but each one is 100 times more sensitive to a single photon than a cone cell is. Rods are connected to seeing in dark settings and with night vision, whereas the 6-7 million cone cells are responsible for actuating the red, green and blue wavelengths. So perhaps this makes sense both intuitively and physiologically with rods outnumbering cones 13:1. Quite interesting.
I found the work of Robert Kosara to be insightful as well. By using luminance without hue as a way to determine consistency in the values of presented data : here. He pointed to a sort of luminance integrity factor. The point was similar to Tufte’s idea of graphical integrity, but instead of using line length to determine the “lie factor”, here Kosara is using luminance as a way to measure integrity. What an interesting way to think about color misleading when the jumps in scale of luminance do not match the jumps in scale of data, and the ratio becomes misaligned with what we see.
I’m truly beginning to wonder if semantics are equally as important as our physiological limitations in how we see. Having a word for something may allow us to notice it more. When Simmon mentions there being no “dark yellow”, all I could see was “dark yellow”, though I didn’t have an exact word match for it. The argument of language playing a role in how we come to internalize color was made clearer to me in the RadioLab conversation on color. An interesting listen alongside the tools and techniques supplied by Simmon.
Question: Do you think language limits our ability to see?
Data visualization is the presentation of data in a pictorial or graphical format. It uses color to display data in many different ways, but the question is how to be reasonable and understandable? According to Robert Simmon, "people aren’t computers. Computer colors are linear and symmetrical, human color perception is non-linear and uneven". Base on this reason, we should choose color carefully when visualize a dataset, consider more about how people can recognize the information from data visualization, and beware of using computer's perception.
As Simmon mentions, "any dataset can be categorized as one of three types—sequential, divergent, and qualitative—each suited to a different color scheme". It explains both dataset and color has the same attribution, and they can translate each other in their own way. Also, the article argues color affiliated with our physical environment and cultural values are linked to certain colors. It supports the view of a good data visualization should use color base on human understanding of the world. Meanwhile, we have to focus on the principles of perception, but not aesthetics in data visualization because it is more about communication rather than aesthetically pleasing.
With my limited experience in creating data visualizations prior to the start of this course, color has been the tool that I have most often not given enough consideration to. While I have used it to denote a value, or more often a difference in grouping or variable; this would often be overridden in favor of using color for a purely aesthetic value. Robert Simmon clearly demonstrates that these two things are not mutually exclusive, and that both elements can be important in creating an effective visualization.
His closing remarks about his views on being considered an artist really resonated with me. “It’s something I am somewhat uncomfortable with, because I feel like they think I am using my opinion, when I am really trying to represent things as accurately as possible.” I appreciate why he worries about the label of being artist and its potential connotations, but I am more inspired by the idea that he can be an artist without making artistic decisions that compromise on the best representation of the data. There are still artistic choices he is making within each of his visualizations, through which color pallet he might use, but the decision is based on careful consideration of the message that color is portraying to the reader. I also appreciate that he does not dismiss the aim to make something visually pleasing, and that it may in fact lead to a more memorable end design.
“Aesthetics matter: attractive things work better.”
DonaldNorman, Emotional Design.
Simmon’s gives clear examples and honest rhetoric about why the most common systems have major shortfalls that should not be overlooked. The standout example of this for me was the rainbow palette.
Simmon’s states that when presenting on a linear scale you want the perceptual change to seem equal. Using the rainbow palette, if the color is near cyan or yellow, the change would seem much larger than if it was in the middle of the green area.
He continues with the observation that the pallete changes from dark to light to dark to light to dark again. His argument for the use of CIE Color Spaces is therefore not really an argument but an obvious choice for use in data visualizations. This is especially true when he continues to discuss how the use of CIE Color Spaces does not have hinder the consideration for both color blindness and the selecting semantically‐resonant colors.
Overall Simmons observations and examples will have a large impact on my process when considering colors in my future visualizations. My largest takeaway from the reading will be the examples, which I think I will print and display in my work space as a reminder of the huge impact the correct color choices can make.
This article, Subtleties of Color by Robert Simmon was incredibly insightful and full of information. I do not have much critiques here as it was more information driven than an opinionated piece; but I will go into details about the lessons I learned and what I wish to incorporate in the future of making data visualizations.
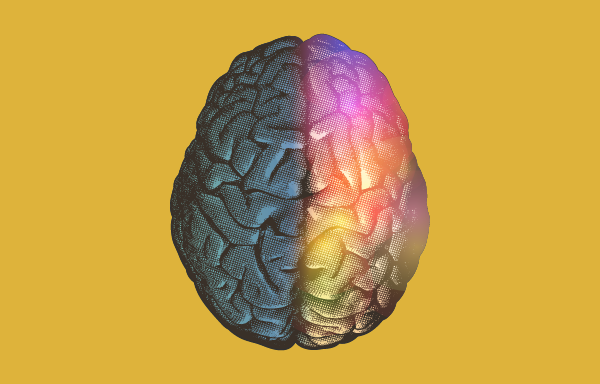
I enjoyed learning about how differently the human brain perceives colors compared to a computer (linear versus nonlinear, symmetrical versus uneven, differences in sensitivity to lightness and certain hues) and I found it super useful to get a (very) basic breakdown of color theory: what is saturation, lightness, and hue.
Diving into data types and the creation of color palettes to represent the differing data types was interesting. Sequential datasets benefit from a color palette that primary changes in lightness (because people perceive lightness most easily), coupled with a difference in hue or saturation. Qualitative data would benefit from color palette with colors as distinct from each other as possible; it is best not to exceed 12 categories, but if you must, try to group classes together and then make sure of color saturation. Divergent colors benefit from having two distinct color hues with a neutral middle part, and the hues differ in saturation and lightness. I have worked with all the three data types he mentioned (divergent, sequential, and categorical) and I somewhat choice similar palettes to what he describes as good practice, but I had no idea why those were the ones I chose at the time. I did not take information-based decisions but worked from intuition, and I was fascinated to learn about why certain palettes work better than others and convey the information more accessibly. Speaking of accessibility, another big lesson I learned is how to choose palettes taking into account color blindness. That is a very valuable take away. Also, speaking of intuition, I really appreciate the section where he covers intuitive color decisions when it comes to eligibility (when working with multiple data layers, use muted colors)and color associations (blue for sky, green for vegetation) and points out that there are cultural differences in that aspect as well (blue for abstract, orange-red for malevolent).
I enjoyed the articles because it was information driven, and coupled with an emphasis for common sense and the subjectivity of human nature. This is essentially the best way to teach about color usage.
Color selection is one of the most consequential design decision. It's not just an addition to make the design 'aesthetically pleasing', it is an critical element that adds meaning and depth to the visualizations. The color choices that usually a designer makes is more intuitive, rather than incorporated based on studies of perception and color scales.
The perceptual space of color varies largely in humans and computers as computer colors are linear and symmetrical while the human color perception is non-linear and uneven. Simmon explaining further reflects a study based on the ways our brains and eyes physically respond to light. He discusses of an efficient method of selecting consistent palette derived from uni-distant numeric values that complement in showcasing patterns and relationships in data.
Simmon elaborately discusses the impact of color palette acting as values. Examples such as '1958 topographic map of Chattanooga, Tennessee' , 'Vegetation Map' and 'Surface temp of dunes' gives an informative imagery perceptions about audience’s preconceptions, cultural associations, layering of information, complementary datasets and color usage. Additionally, he also briefly gives a glimpse of data tools in order to create an ‘ideal’ palette. He discusses the methodology and also gives an overview of tools worth exploring with an additional framework for the construction of the palette. The reading also reflects to a lot of resources for references for everyone.
A thought by which I was provoked the most was the design accessibility. There are braille, sign language acknowledging the special population, but the design world seem to be little unreasonable for the color-blind population. Working in design for seven years now, I never realized the importance of color selection for the special population. With this article, I feel the author has given me a perspective and made me conscious for the consideration of adaptive designs.
This series of readings, Robert Simmon lays out a simple guide of strategies and schemas to help with decision around color in visualization. It sets up set up a deceptively simple framework for choosing and working with color in visualization. Starting with conceptualizing color along three parameters:
Hue: the pure pigment that can be objectively perceived from person to person
Saturation: the intensity of the color
Lightness: the variation in the perception of the color or color space's brightness/ tone
we can examine our decisions with respect to how human perception interacts with each parameter, and how meaning is encoded with color.
Another key set of distinctions are the different types of data:
Sequential: data is changing continuously
Divergent: data has a midpoint from which both ends of the spectrum diverge
Qualitative: data is categorical
With these two sets of first principles in place, some other key findings from research on perception and visualization come into focus:
a palette should minimize errors from the color shifts introduced by nearby areas of differing color or lightness (simultaneous contrast)
different palettes are suited for different types of data
color scales with varied hues and contrast are suitable for representing different datasets.
Computer colors are linear and symmetrical, human color perception is non-linear and uneven
In the above statement, he cautions that designers must pay attention to the ways in which color, shape and space can collaborate to trip up human perception. Since visualizations should aim for universal comprehensibility, we must make adjustments for optical illusions or "artifacts" that the human brain can create where no data is actually being encoded.
For me, one of the most effective presentations of this phenomenon was "simultaneous contrast", in which the same color of grey (50% lightness) can be perceived dramatically differently when placed against a background that also changes lightness.
Calling upon the literature, Simmon advises that "a color scale should vary consistently across the entire range of values, so that each step is equivalent, regardless of its position on the scale. In other words, the difference between 1 and 2 should be perceived the same as the difference between 11 and 12, or 101 and 102, preserving patterns and relationships in the data."
To further support this point, we are duly warned to avoid the temptation to use the "rainbow color scale", as our brains have trouble correctly perceiving shifts in color, which can distort our perceptions of changing patterns in the underlying data.
Instead, he advises us to combine a continuous increase in lightness with a shift in hue
this preserves both form and quantity.
Intuitive Color
The guidelines for what colors to use seem to continue to follow the internal logic of "picking the ones that immediately register as sensible to the human mind"
For example- water is blue in nature, therefore blue hues are the most natural candidate to represent water (unless the data is about water temperature- in which case a sequential red palette may work better)
Vegetation is green in nature, therefore so should it be in a visual encoding of the presence of vegetation on a map.
There is a slight caution here however to be aware of cultural biases in assuming that these associations can be universal (e.g. red might be an obvious choice for temperature, but it also has an implied significance in Western cultures for fiery emotion, evil, or "bad indicators, whereas in Eastern cultures, it has more positive connotations). This is more of a subjective note, and is more of a reminder to think about the intended audience/ be aware of such nuances between cultures.
Unfortunately I can’t provide any hard and fast rules to design visualizations that are aesthetically pleasing (or even beautiful). I can only encourage you to keep your eyes open. Look for good design, good art, and good visualization. Figure out why it works, and incorporate those elements into your own projects.
It was slightly deflating to have this disclaimer come only at the end of the 4th installment- is there really an objective way to make these calculations in every case given the research or is it all really still a matter of subjective judgement? How do we really know that we are making the right choice if intuition can still play such a large role?
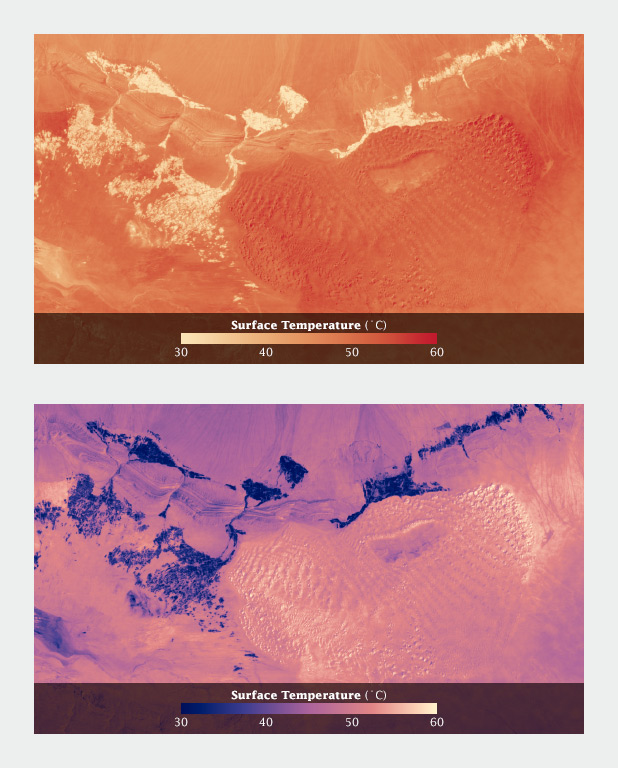
without any guidance on how this color scale works- would the average person realize that the white values in the second image actually represent higher temperatures? (my guess is no). This is the kind of artifact of the way humans are practiced to interpret colors and color scales that we are forewarned about.
My Concluding Thoughts
Color is still one of the most challenging aspects of visualization that I grapple with, even with these guidelines provide by Simmon. But that's why I'm grateful for the existence of Chroma.js and Color Brewer to minimize some of the anxiety around these choices.
Finally, since much of what is discussed in this reading relates exclusively to visualizations on computer screens/ static paper, I wonder how the psychology of color differs with real world/ 3-D printed visualizations?
In the blog series Robert Simon reemphasized the relationship between color and data visualization —color should enhance clarity, aids storytelling, and draws a viewer into your dataset— touched the importance about assigning appropriate color palette based on the data type. He also mentioned the intuitiveness of color as well as the cultural values they embodied, and how can we utilize that to add cues into our visualizations.
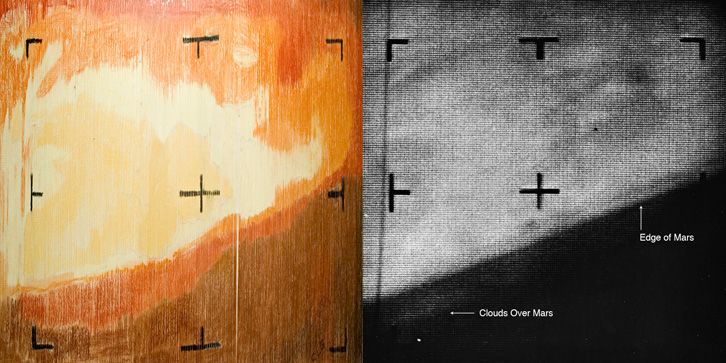
The most memorable example to me was the first image of Mars hand-colored by NASA’s Jet Propulsion Laboratory. It’s amazing to see how they translate numeric values to color’s hues and utilize that to visualize something human eyes wouldn’t detect from the number itself. And it turns out that the human generated picture is very close to the computer generated image. Although it wasn’t intentionally, but the brown/red color scheme they picked randomly resonate with Mars actual color.
Speaking of intuitive palettes, if we look into our daily lives we would find out a pattern there as well. Why the majority of fast food restaurants use red&yellow color for their logo (eg. McDonalds, KFC, Chick-fill-A, In-and-Out you name it…)? Why most of banks use blue as their main tone(eg. Chase, Citibank, Capital One)? According to scientific research, color red revs up people's appetites, it has just become synonymous with fast food over time, perpetuating the idea that red makes you hungry. And we tend to associate confidence and stability with color blue, that’s how banks want us to think that way by looking at their logo as well. However this intuitiveness might vary across different cultures
Another interesting fact that’s been raised in this reading is that we human perceives color differently from computers. Robert pointed out that “We perceive light exponentially as opposed to the linear way of a computer. We are more sensitive to changes at low light levels, and the range of colors perceived by us is uneven.” it's customary to ignore that fact that color defined by computers are different from human definitions, when we are designing visualization we need to consider its ultimate media whether it will be put up on a website or printed out as a tangible piece. Because colors on screen look different from printed material as well.
Elegant Figures was interesting from both the perspective of a color theory fan as well as the perspective of someone interested in examining the differences between the arts and sciences industries as they currently exist. It was curious to hear the design choices advocated for by visual experts in the sciences, versus knowing from experience what challenges present creative professionals. The industries can learn a lot from each other, which has excitingly been happening more and more in the last decade.
The design world would have quite the opposite problem of the pervasive rainbow pattern - often you see designers going too off the rails or not bothering to stick with sensible defaults. In scientific visualization, it would seem that amateurish palettes are born from a lack of imagination whereas in design, it would seem that amateur palettes are born from overexcitement. The common ground, it would seem, is that bad palette choices are those made thoughtlessly.
You see this in other industries as well, and I would be interested in studying the negative effects of information communication on bad color choices made in business, UX, and media. This raises the question: should color choices be more standardized? In the algorithm developed by Stanford’s Visualization Group, they aim to choose semantically-resonant colors for specific data visualizations. Would this help improve communication, or limit designers? It would be great to be able to generate palettes based on semantically-resonant keywords across industries, but also be able to break it when needed, as Simmons’ described in his “perfect palette tool” (Part 5). This would take a vast indexing of visually relevant keywords across themes in multiple industries, but could be aided by machine learning language and imaging processes. I personally be interested in exploring how we could use color to express political affiliations and bias to examine the use of color from a media literacy perspective.
In Subtleties of Color, Robert Simmon emphasizes different functions that colors play in data visualization. Choosing colors for a data visualization is not just simply looking for random color combination from any color palettes. Instead, an appropriate use of colors could improve the meaning, clarity, storytelling, and readability behind the data visualization.
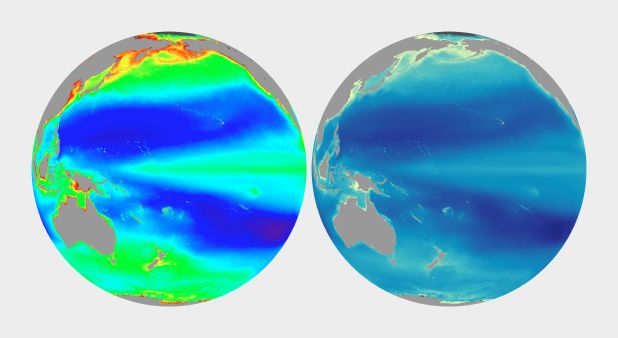
The section that I found the most interesting is Connecting Color to Meaning. Robert Simmon raised the idea of intuitive colors, which could help non-experts interpret the data visualization based on their perceptual understanding. The example Robert Simmon presented is two satellite visualizations in different color uses.
The example on the left is a satellite visualization that scientists normally view, with rainbow palette. However, it became difficult for novice viewers to understand the meaning of each color because the meaning of the rainbow colors here have a different meaning compared to what non-experts understand. It is easy for them to relate warm colors and cold colors to temperature- red, orange, and yellow represent hot and blue for chilly. When transferring the unnatural colors of the rainbow palette into the example on the right for phytoplankton, the confusion could be somewhat ignored- dark blue for ocean, the gradient of turquoise, green, and yellow for increasing concentrations of plans and algae.
These blogs remind me of an article about using semantically-resonant colors to represent data I read before. I think when applying these concepts into data visualization, we also need to consider how the meaning of colors varies in different culture. For example, in the U.S., we commonly use red for decreasing and green for increasing in stock. However, in China, we would use the opposite colors.
In The Subtleties of Color, Robert Simmons gives us a crash course on color theory for data visualization. Providing examples from his own work as Lead Data Visualizer and Information Designer at NASA, Simmons sheds light on perceptual issues with traditional color choices and provides solutions for semantically resonant visualizations.
The article provides a brief overview of human perception of color, highlighting that the RGB (red green blue) color space is ill suited to the human eye since we inherently perceive these three colors at differing levels of brightness. Instead, Simmons recommends the use of lightness, hue, and saturation in the CIE or L*C*h color space, which provide consistent perceived changes across a palette.
Simmons goes on to provide color solutions for three types of data defined by Cynthia Brewer: sequential (continuous), divergent (including a break point), and qualitative (categorical/nominal). Here he also highlights the historic use of color by cartographers, noting that some of the best examples of color use in data visualization have emerged from this field.
Bringing all of these points together, the article concludes by discussing semantically resonant or ‘intuitive’ choices that align with pre-attentive processing, or the unconscious perceptions made by the human eye and brain before additional interpretation takes place. Here the article provides example maps and visualizations, as well as resources and open source tools available to readers for their own visualization work.
Having worked briefly in the city planning field and struggling with color choice for maps on many occasions, I found Simmon’s discussion on the subtleties of color incredibly useful and relevant. While open source tools like Color Brewer are helpful in providing pre-selected ‘safe’ palettes, I have never fully understood the reasoning behind these palette color choices and why some work better for particular data types or visualization methods. Reading this article felt like putting a magnifying glass up to something that I’ve been trying to read for a long time from afar.
It was also exciting to hear Simmons talk about mapping and spatial data in his presentation version of the article. I appreciated his willingness to push back on traditional color choices and imagine new standards in fields that have longstanding traditions and often longstanding disagreement with the idea that ‘aesthetics matter’ and ‘attractive things work better’. I like the idea that these choices are scientific, not just based on individual taste. Beyond their semantic resonance, I often found Simmon’s color choices more visually pleasing that the counter examples he provided. I’m curious to know what others think about this - did you all prefer his choices based on pure ‘taste’ and do you think that ‘taste’ always aligns with semantic resonance? Are things that are easier to understand naturally perceived as more beautiful?
One of the aspects of this program that I was most looking forward to is understanding how humans perceive visuals subjectively and objectively and how that relates to the dynamics of computer systems. It is interesting to hear how computers and humans look at color differently. It is extremely important to understand the best way to communicate with each as a visualizer. I am really happy to hear the CIE studied some of these differences and has offered options for us to use this information in designing for both computers and humans.
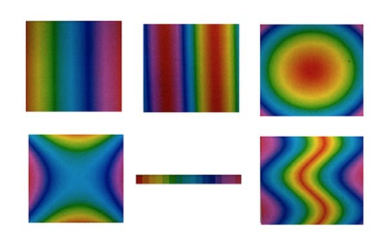
In the first part of the blog, there is a lot of attention on hue, saturation, and lightness. It sounds like this combination allows for the best communication (compared to others) when used appropriately. Are there any situations where other categorical combinations of colors would work better to express a certain dataset? This whole concept seems overly granular but we as visualizers should always strive to express data through colors as effectively as possible. Some of the blog’s examples of color ramps have specifically exemplified these seemingly inconsequential yet obviously impactful differences in choices around showing color change (ex: linear vs. logarithmic).
Understanding more about the choices around cartographic design was a fun process since I have a background in GIS. I have thought a lot about these choices but have never read about them in such detail. Experts have studied many hours to define the best actions for color in certain categories. I really liked the USGS map that displayed land cover in Oregon because it figures out a way to intuitively present sixteen different colors by grouping similar categories together. Although a user may not read the map and try to find every difference, it gives the viewer a clear understanding of the land cover trends in the area.
As a final note and following my thoughts in the previous paragraph, it was nice to see the tools and tips for creating color in the mapping program I used, Acrmap. Using the symbology tool in the software was one of the most entertaining parts of my job. It is cool to know that color brewer is used in the program.
The author's experience with color, coming from NASA, emphasizes the importance of color maintaining accuracy and scientific resonance. The examples that he used to communicate where lightness, saturation, and hue can be used and misused were easy to understand and reminded me how important it is to be strategic with color choice. Because of the different factors that make up what we perceive when we look at color, it becomes a multidimensional element and can be very rich in information when used properly.
I am interested to look further into the Nasa Color Tool and to practice using L*C*h when selecting colors instead of defaulting to whatever program I'm using seems to prefer. The examples showing how differently spaced the rainbow hues are from each other made it much more clear on why "stepping" from one to the next is not actually accurate when communicating a proportionate change in data. This example below showing L*C*h vs. HSV helped me understand how there is more room for perceiving variation in color with L*C*h.
The pre-attentive processing and intuitive notions on color are aspects that are essential for those working with data visualization to be cognizant of. I am curious if there is a methodology or step-by-step process to walk through when beginning to consider color. For example, first determining what is and what isn't data, then considering what variables may or may not have an intuitive or cultural association with color (for example, water), and finally, what relationships do all the variables have to each other and how should the colors differ. There also needs to be a time to check your work to make sure that the colors you're using are accurately representing the data and can be perceived by people with color blindness. The example Simmon used with the surface temperature heat map was a helpful demonstration of the necessity to check-in, by showing that palettes that may work at a large scale, may not work when zoomed in to a more detailed scale.
Robert Simmon: Surface Temperature Example
Overall, this article and video are a great reminder of how specific and strategic a data visualization designer must be when selecting colors to represent data. Not only must color be representative of the data, accurate in its changes, perceptible, and aligned with preconceived notions, it should also be all around aesthetically pleasing. Color should never be an after thought.
The lecture of Robert Simmon, a lead visualizer for the Nasa Earth Observatory, did not leave any questions unanswered. It demonstrated and answered questions regarding use of colours in a very scientific way. This is helpful for me. As a graphic designer I use a lot of "rules" demonstrated by Simmon, intuitively; probably through the experience gained working in visual communication.
However, personally, I am influenced by and enjoyed a swiss education in graphic design. A kind of doctrine as "if you cant convey the information in black and white, you are not finished" is deeply rooted in my approach to visual communication. I am still starting any project in black and white — and add color in a later phase, if necessary.
Simmons lecture poses the question for me personally, if thats still the approach to go or to start considering colors in an earlier phase.
On another note it was striking to see, how attracted I ( and supposingly others also) were by the handcolored visualization. Rich, "real" colors (still) have a greater impact on human than colors which are purely generated in pixels. Another proof for it are the so often quoted cartographic maps (often swiss made). Their "sucess" is not only the very good design, but also the very good printing quality and the rich printing colors (due to a special printing process). It shows that good/worthy "material" can have a greater impact when conveying information. The information designer Joost Grotens and his studio, as a contemporar example, puts great emphasis on actual good quality of material of their information design (http://www.joostgrootens.nl/#mapping)
Why do colors process in terms of red, green, and blue and not the primary colors of red, blue, and yellow?
Can layering color palettes on top of each other, as is the case with many maps (an "earth tone" color palette for topographical formations, a black one for artificial structures) clutter up the image and make it harder to interpret? Is it better to use a different retinal variable across different dimensions of the same data or can you use color across several different variables in your data?
"Follow good design practice as well as good visualization practice when developing imagery. In addition to color, consider the other aspects of design: typography, line, shape, alignment, etc. Be aware of the media you’re designing for. It may be trite, but a good visualization is better than the sum of its parts. Be aware of how the various elements of your design fit together. How do the colors used for the data interact with labels?"
Is color best used for continuous data variables (for instance, mapping to a gradient of hues to represent something with a large number of degrees between them) or for discrete data categories? (for instance, men vs. women, children vs. adults, or decades of the twentieth century?)