In this chapter, Drucker dives into the lineages of graphical representation. Firstly, she organizes graphical representation by type. She makes the distinction between visualizations that are representative of static information versus knowledge generators (visualizations capable of creating new information through their use). Then she categorizes by form (graphical format, purpose, meaning etc.).
Timekeeping
The earliest charts depicting timekeeping derived from observations of the heavens. Those types of charts demonstrate a capacity for abstraction. It imposes a conventional, schematic order on natural phenomena and then functions. Drucker goes on to point out that we are accustomed to understanding the heavens as a set of quadrants and coordinates that we barely register these systems or graphical conventions. The celestial sphere projects a sense of rhythm, order and regularity onto temporal change.
Space-making
Spatial graphical representation reconciles spatial data and maps of all kinds with a given standard. Drucker points out that the greater intellectual challenge of map visualizations is to create spatial representations without referencing a pre-existing mapping data. Spatiality is always relational, and it's difficult to visualize without having that context. In history, early maps served two main purposes: navigation and way-finding or the identification of ownership and administration of property. Abstracting this type of visualization into a typographic view requires understanding and rationalization of surface and its ordered schemes. According to John Rennie Short, there are six distinct spatial discourses when developing a map visualization including: the emergence of cosmography, the mappings of the world, the navigation of the oceans, the surveying of the land, and the annexing of the colonial territories. Drucker makes a note of noting the importance of the imposition of the schemes. Schemes meant to serve particular purposes, transformed maps from descriptive to instrumental artifacts. I thought it was interesting when she noted that mathematical thinking would not have advanced without spatial techniques.
Record-keeping
Record-keeping was important to the development of graphical principles. Static arrangement of information in tabular forms were the earliest type of this visualization. There is also the generative act of reading across and down, through the coordinate system to find information. Sequence and order are constituted spatially as well. Statistical graphs and other forms of data display from record-keeping are the intermediate forms between the static format of charts and the dynamic design of knowledge generators.
Trees of Knowledge
This type of visualization can be described as such: a their structure is static but their spatial relations carry meaning. The nodes and the branches embody value. They can also express relationships. In history, popular use of this type of viz include genealogical trees. Drucker points out that network diagrams and topic maps have many features in common with trees, but they are not hierarchical. It's important to note that Trees of Knowledge almost always express a directed graphs whose order cannot be reversed.
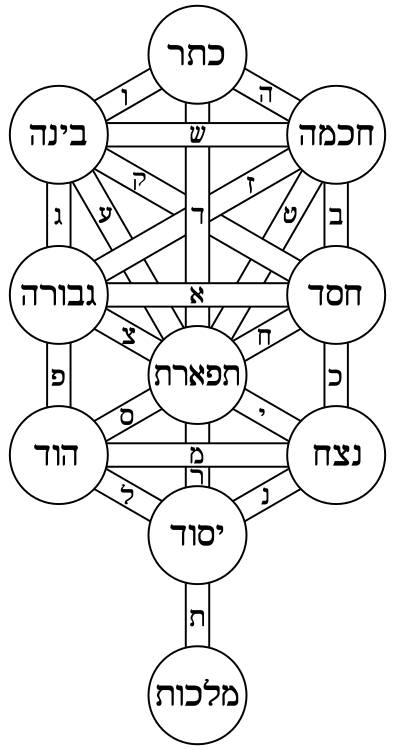
Knowledge generators
Knowledge generators are graphical forms that support combinatoric calculation. Their spatial organization may be static or mobile but their spatial features allow their components to be combined in a multiplicity of ways. The most interesting part of this section was the look at the Sephirotic Tree from Kabbalah, a set of Jewish mystical practices. The Sephirotic Tree is distinct among other occult practices by vitrue of being diagrammatic - the shape of its organization and the intellectual structure it represents are the same. Its generative potential is spiritual knowledge rather than rational or intellectual insight. The mind must move through its structure to engage with the visualization.
Dynamic systems
Diagrams of dynamic events use dynamic elements such as vectors, or directed graph lines, direction, flow, movement and rates of change as components whose spatial order creates a graphical field. Diagrams of dynamic processes are different from knowledge generators as they are not meant to produce an outcome that can be repeated.
Humanistic methods
Drucker defines humanistic methods in visualizations as counter to the idea of reliably repeatable experiments and is more so focused on the experiential, subjective conditions of interpretation. The shift away from standard metrics to metrics that express interpretation is an essential move for humanists - to look at the perceived phenomena instead. Interpretation is stochastic and probabilistic in nature, not mechanistic and its uncertainties require the same mathematical and computational models as other complex systems. I am quite partial to this way of interpreting information and really enjoy Giorgia Lupi's work, who is a modern day believer in humanistic approaches in her visualizations.
Visualizing interpretation
Drucker suggests four basic levels of interpretation of knowledge production with a humanistic element:
1) Modelling phenomenological experience in the making of humanities
2) Modelling relations among humanities documents.
3) Modelling the representations of temporality and spatiality that are found in humanities documents
4) Modelling the interpretation of any of the above.
Points of discussion
- How can we visualize the uncertain when the relationship between observation and interpretation is so interdependent in data visualization?
Sources
Drucker, Johanna. Graphesis: Visual Forms of Knowledge Production